Don’t memorize it.
Play with it.
play2lrn turns the concepts that never quite stick — ad auctions, projectile motion, search intent — into simulations you can drag, break and replay. Move one control and the idea explains itself.
Read it. Re-read it. Highlight it. Forget it.
- A definition you can recite but not use.
- A diagram that never moves.
- A worked example with someone else’s numbers.
- Thursday, and it’s gone.
Grab a control. Break the thing. Now you know.
- Every variable is a slider you can move.
- The output redraws the instant you touch it.
- Your numbers, your experiments, your mistakes.
- Understanding you can rebuild from scratch.
Pick a shelf. Start with any simulation.
New simulations land regularly — search or filter by category to find one.
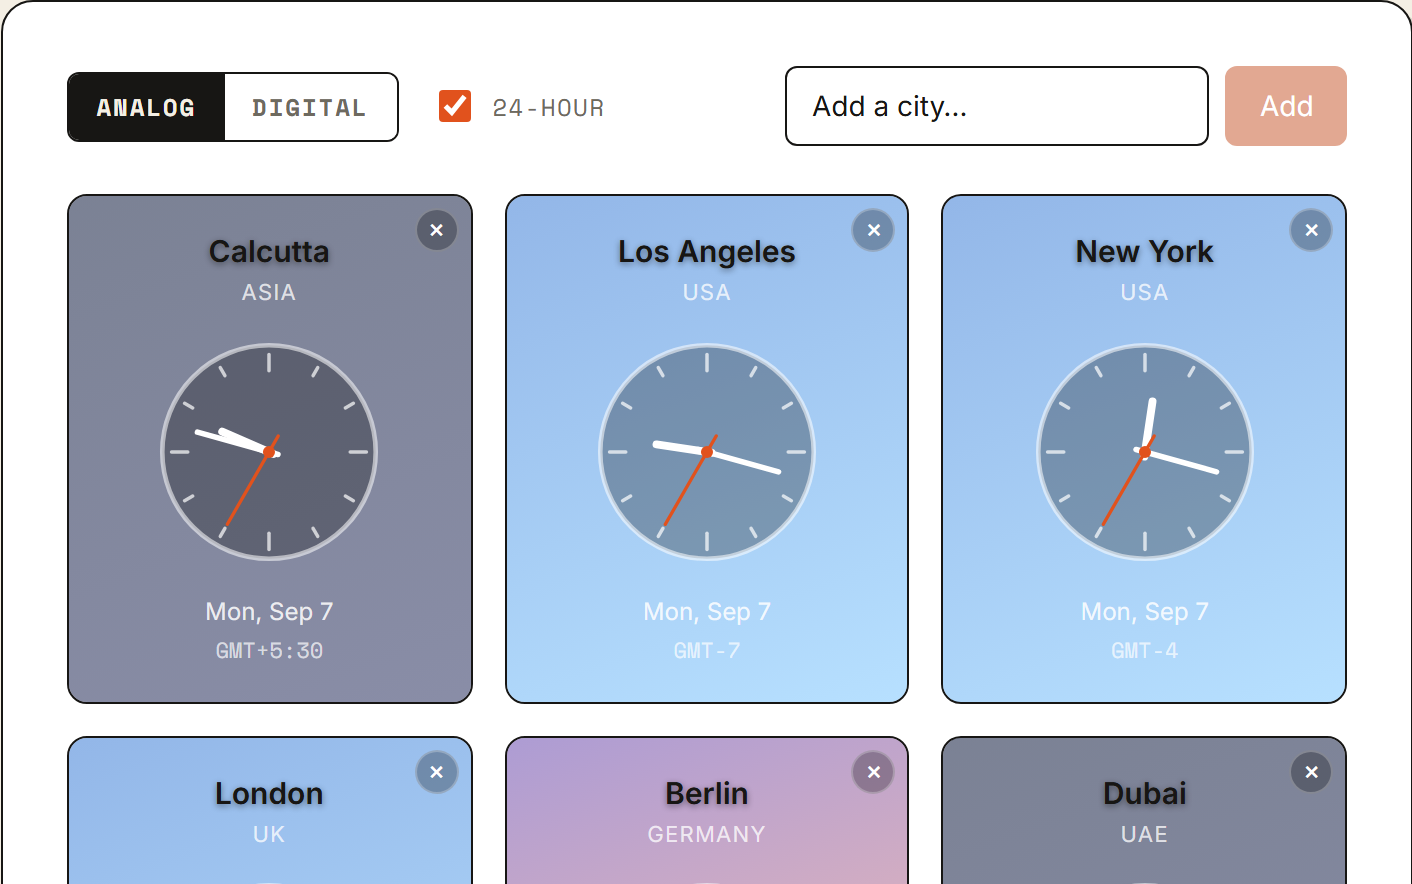
World Clock
Track the current time in cities around the world. Add or remove cities, switch every clock between analog and digital faces, toggle 12/24-hour format, and watch day and night sweep across the time zones in real time.
Play with it →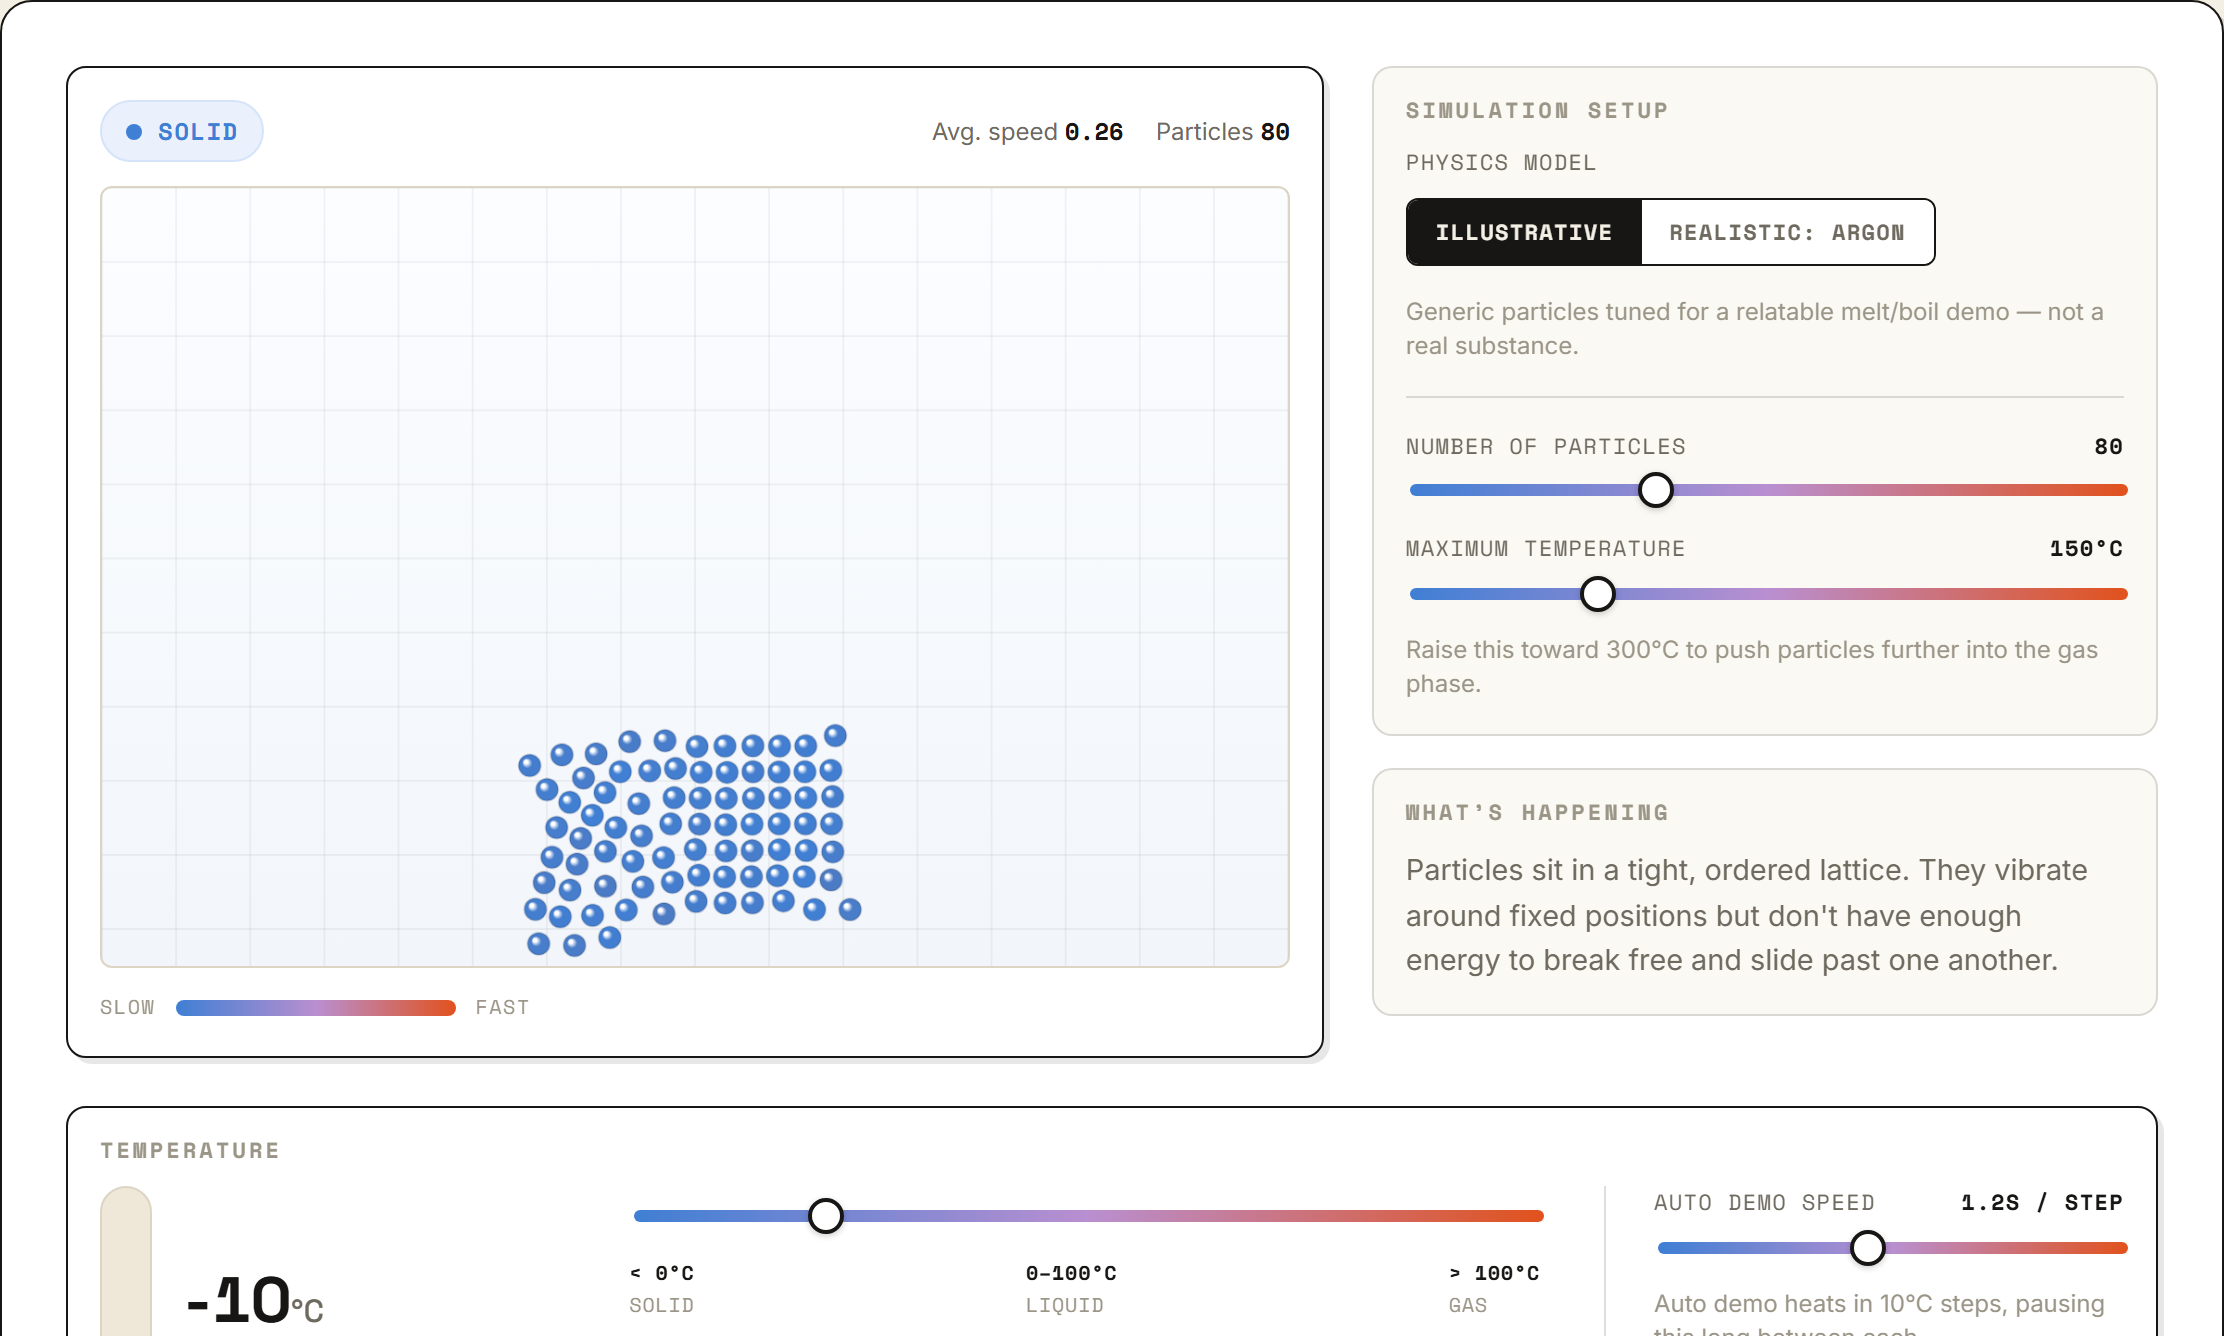
States of Matter
A particle model of solids, liquids, and gases. Add or remove heat and watch how spacing, bonding, and speed change as the substance crosses its melting and boiling points. Switch between a friendly illustrative model and a real Lennard-Jones argon model.
Play with it →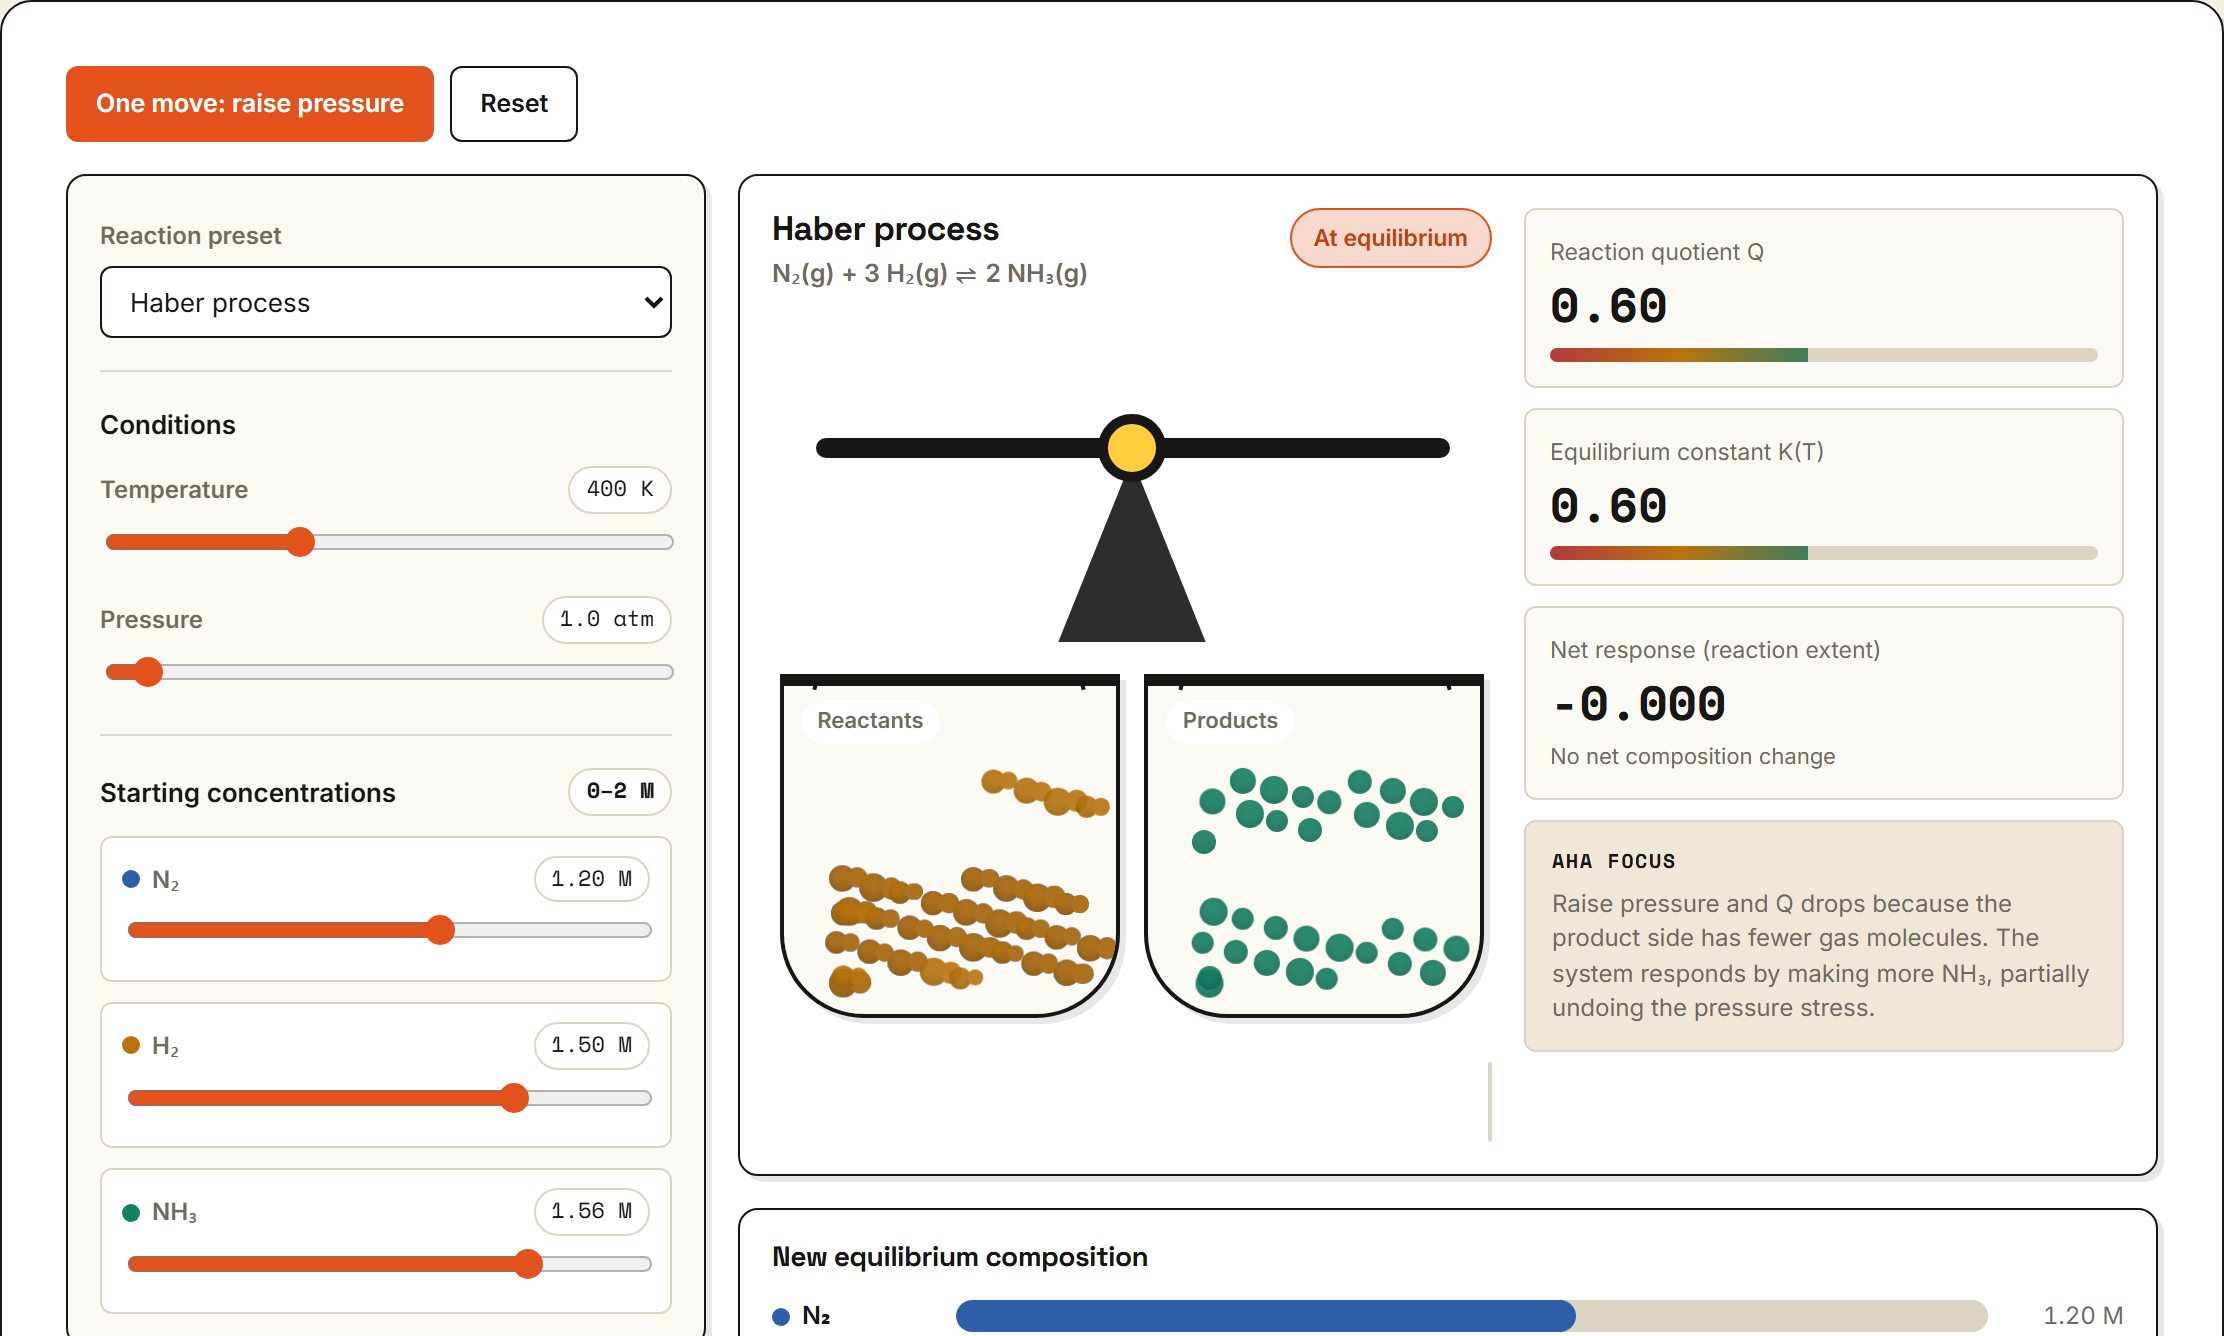
Le Chatelier Equilibrium Shifter
A single-equilibrium teaching model of Le Chatelier's principle. Pick a reaction (Haber process, ester formation, or salt dissolution) and change its temperature, total pressure, or any starting concentration. A van 't Hoff relation moves K with temperature; a gas-mole pressure term and a bisection solver find the reaction extent that restores Q = K, then a tilting two-pan balance, live Q / K meters and an animated composition chart show which way the mixture shifts and by how much. Illustrative — activities are approximated by molar concentrations.
Play with it →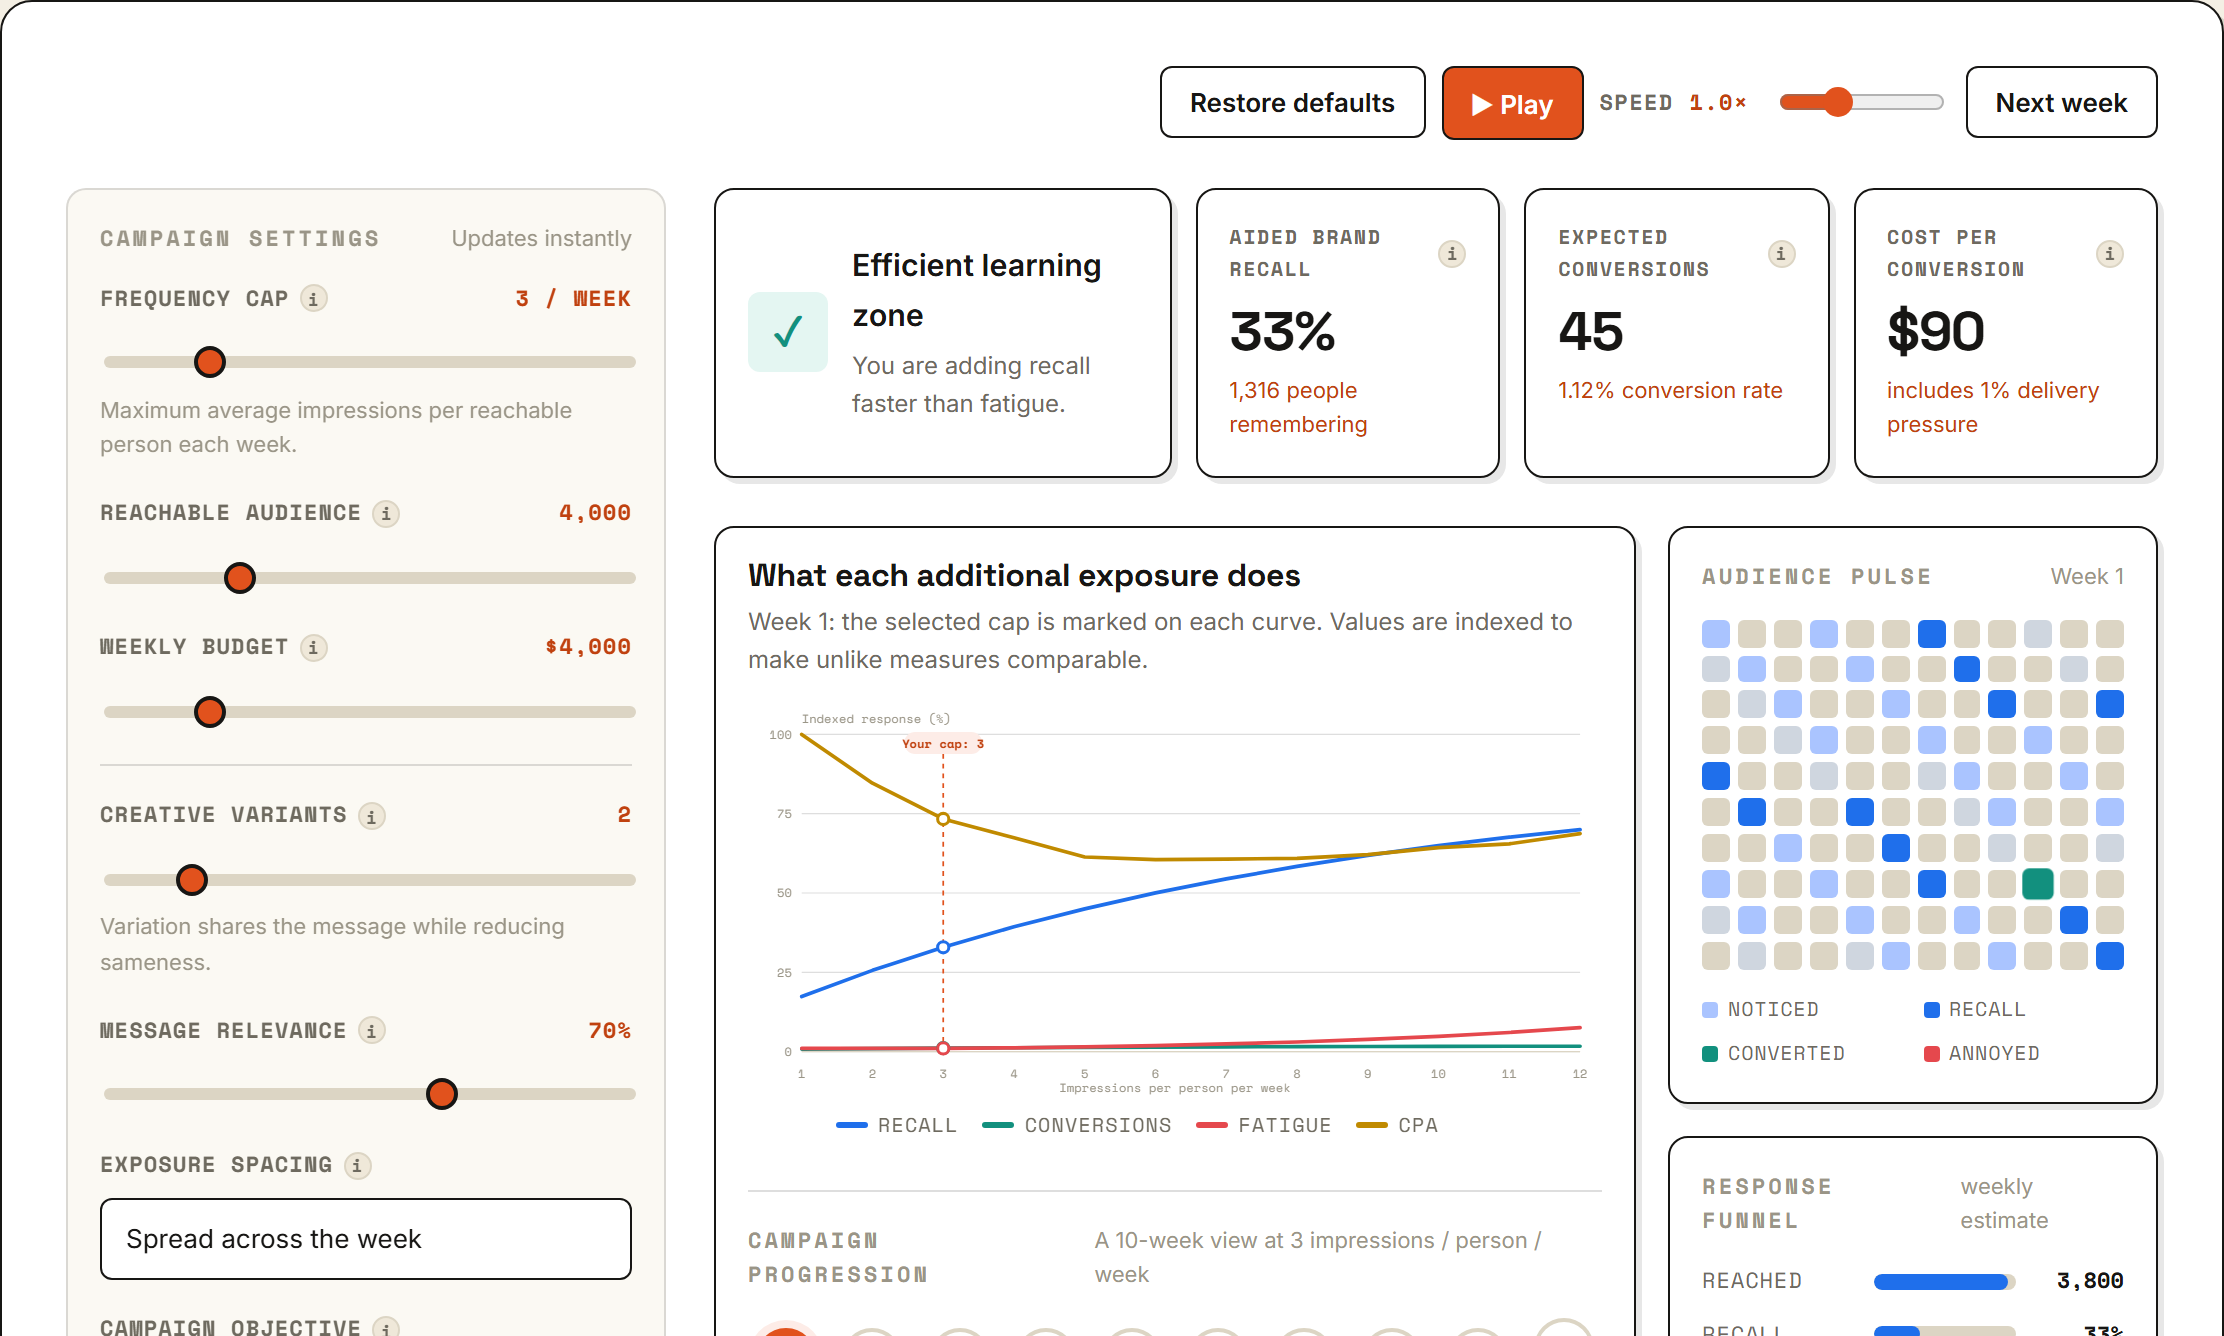
Ad Fatigue Simulator
An illustrative media-planning model of the trade-off between reach, memory, response, and fatigue. Set a frequency cap, audience, budget, creative rotation and relevance, then step through a 10-week campaign and watch recall, conversions, fatigue and cost per conversion move together.
Play with it →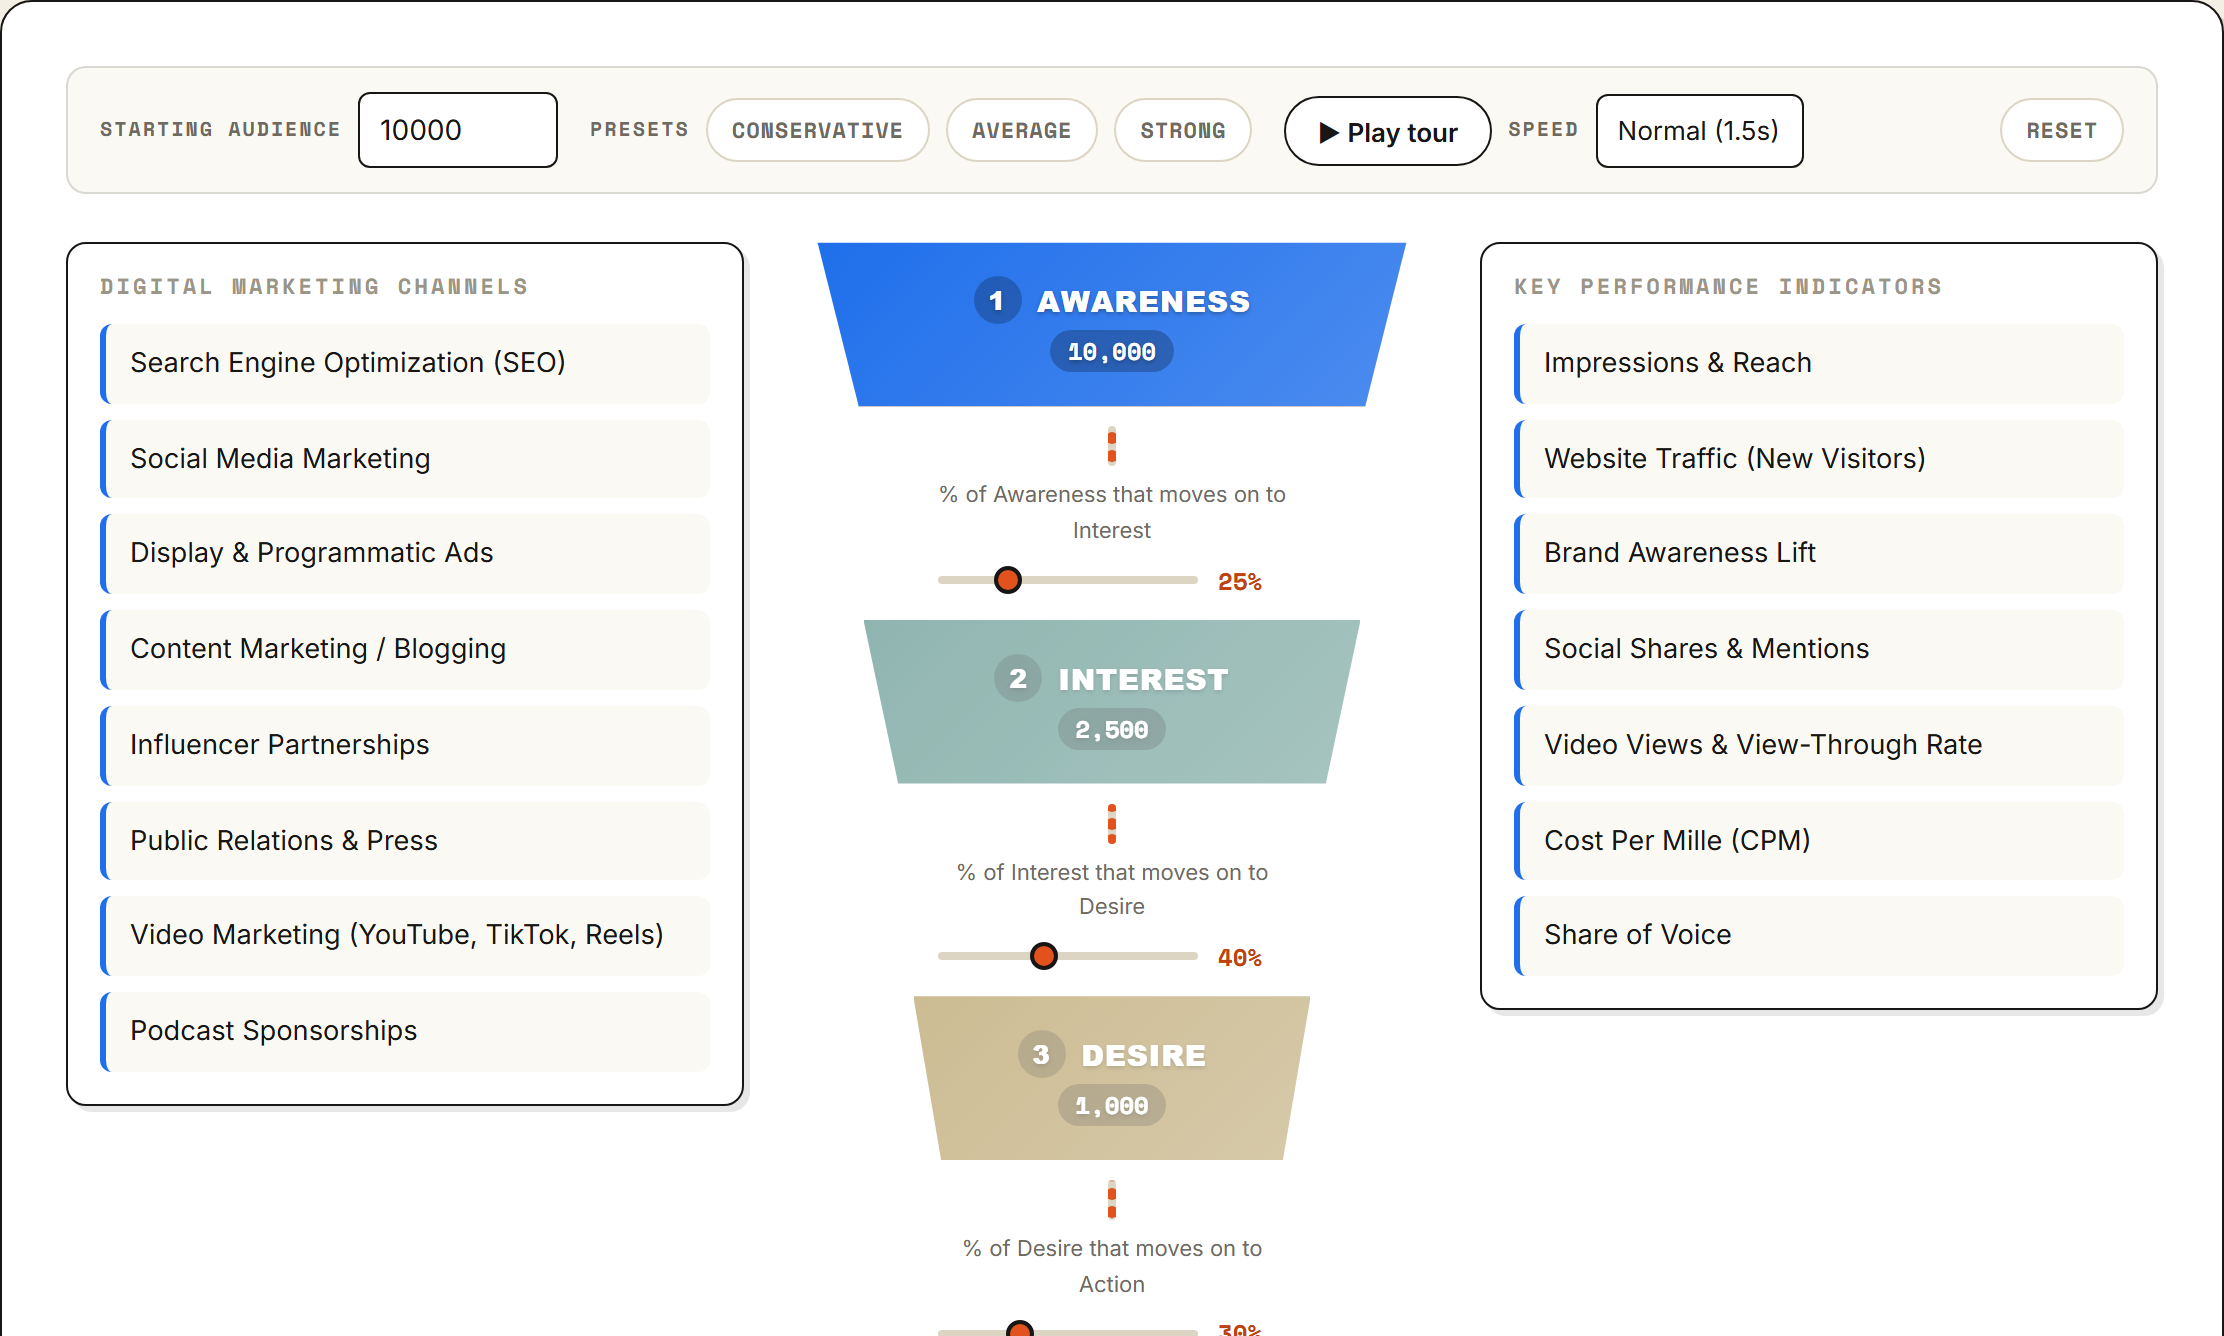
AIDA Marketing Funnel
An interactive AIDA funnel: a starting pool of prospects moves through Awareness, Interest, Desire and Action by the conversion rate you set between each pair. Adjust the audience or any rate and every stage below recalculates live. Click a stage for its channels and KPIs, or run the guided tour.
Play with it →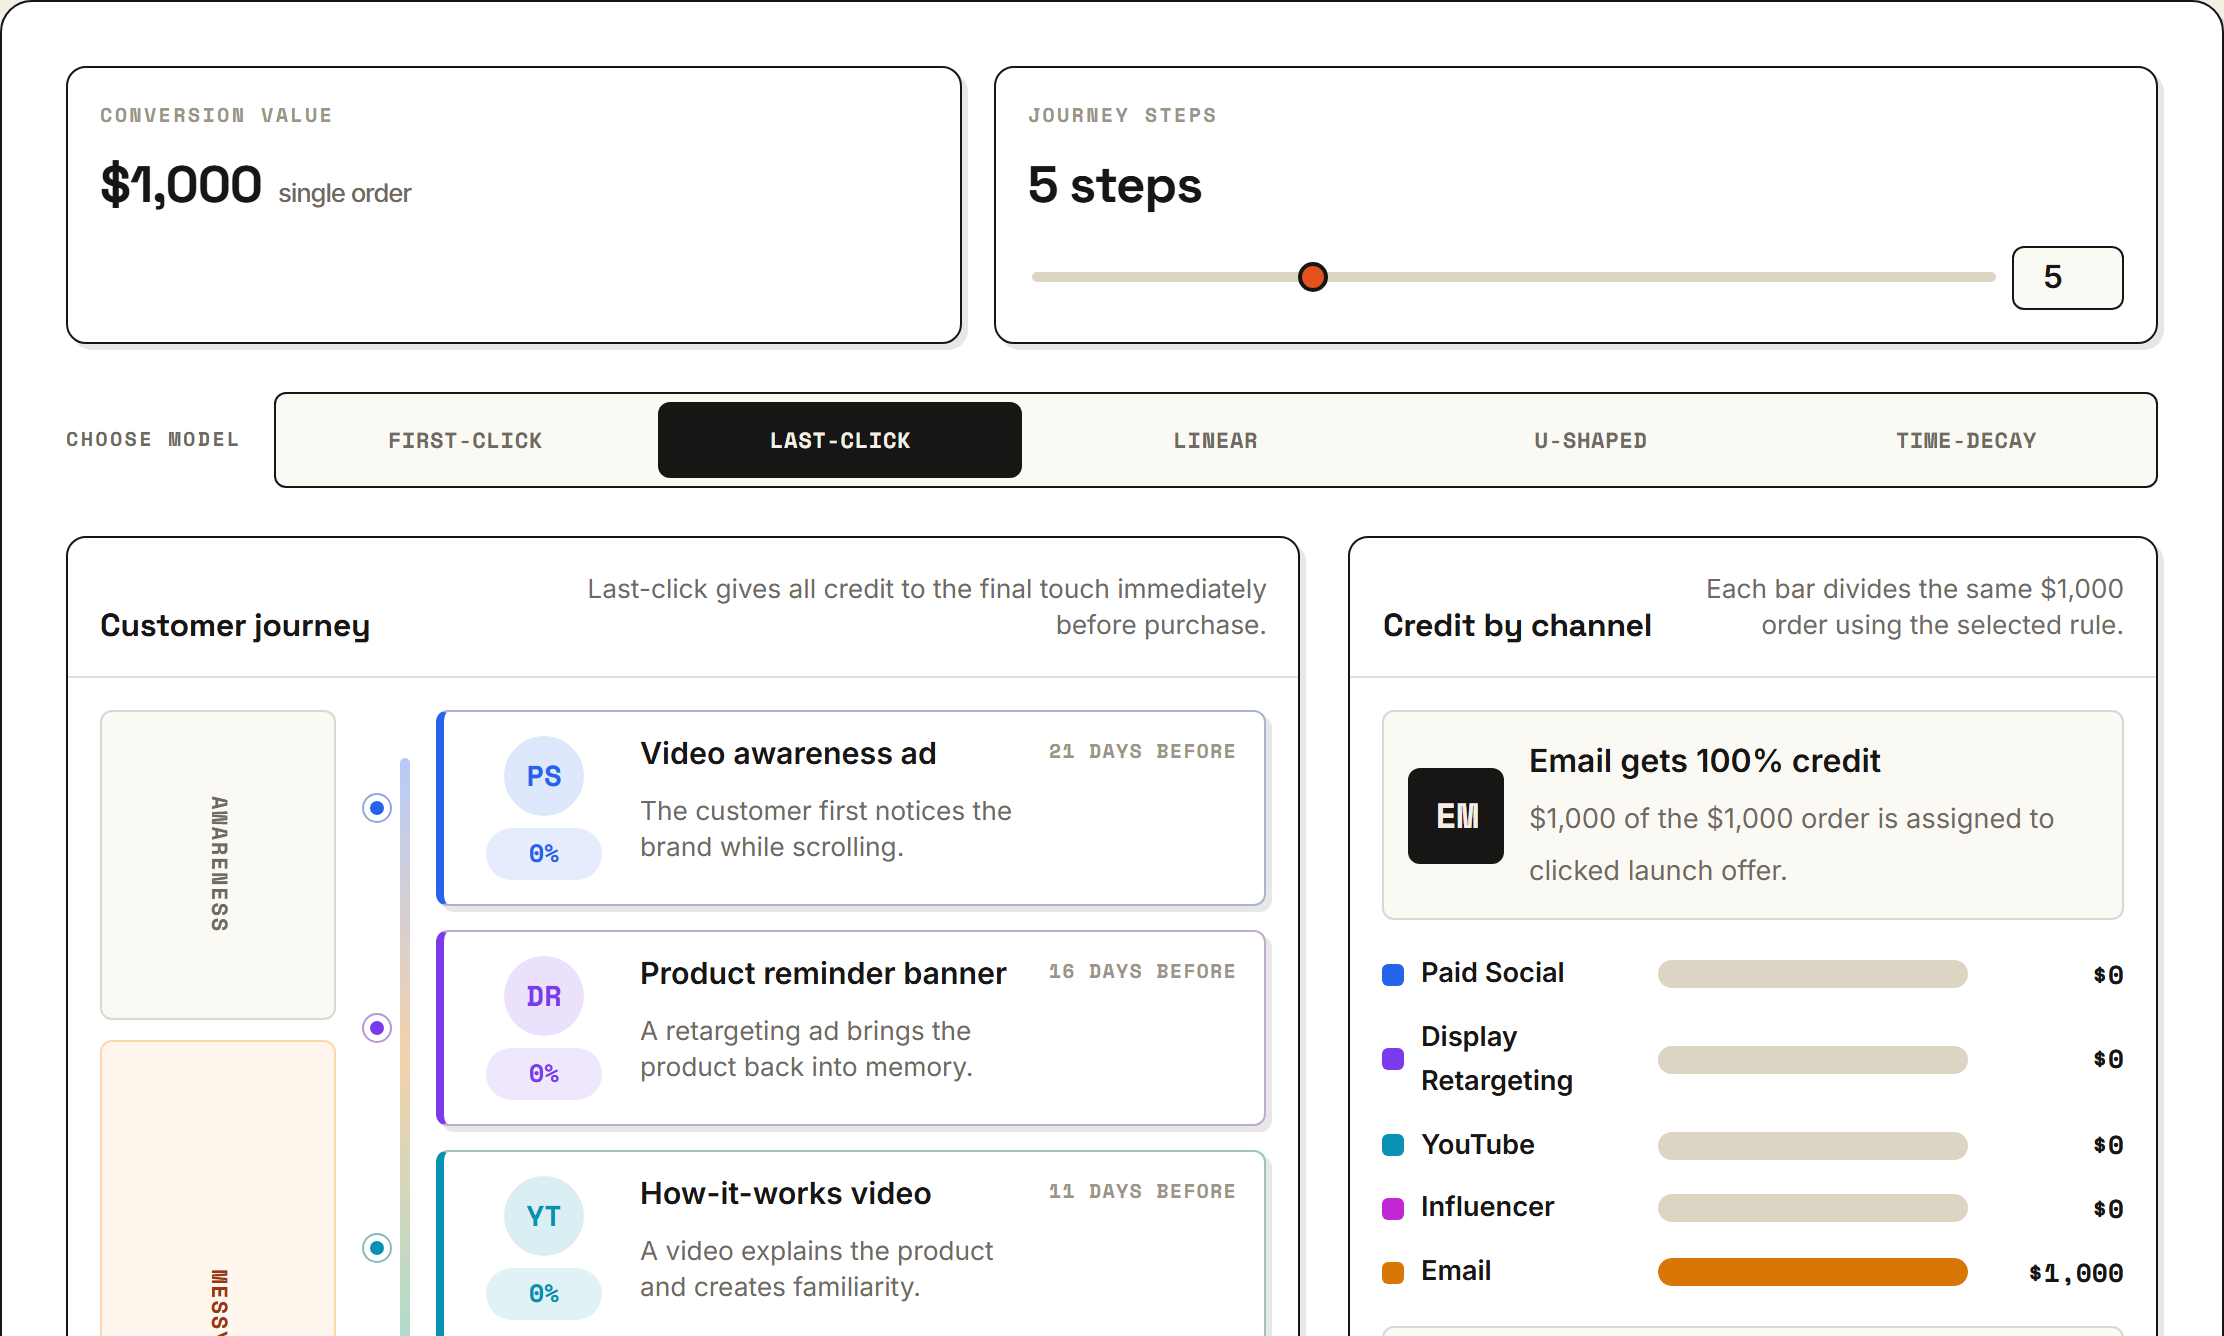
Attribution Modeller
A fixed customer journey across paid social, retargeting, video, email and search. Switch between first-click, last-click, linear, U-shaped and time-decay attribution and watch the same order value redistribute credit across the touchpoints. Adjust the number of journey steps and the time-decay half-life.
Play with it →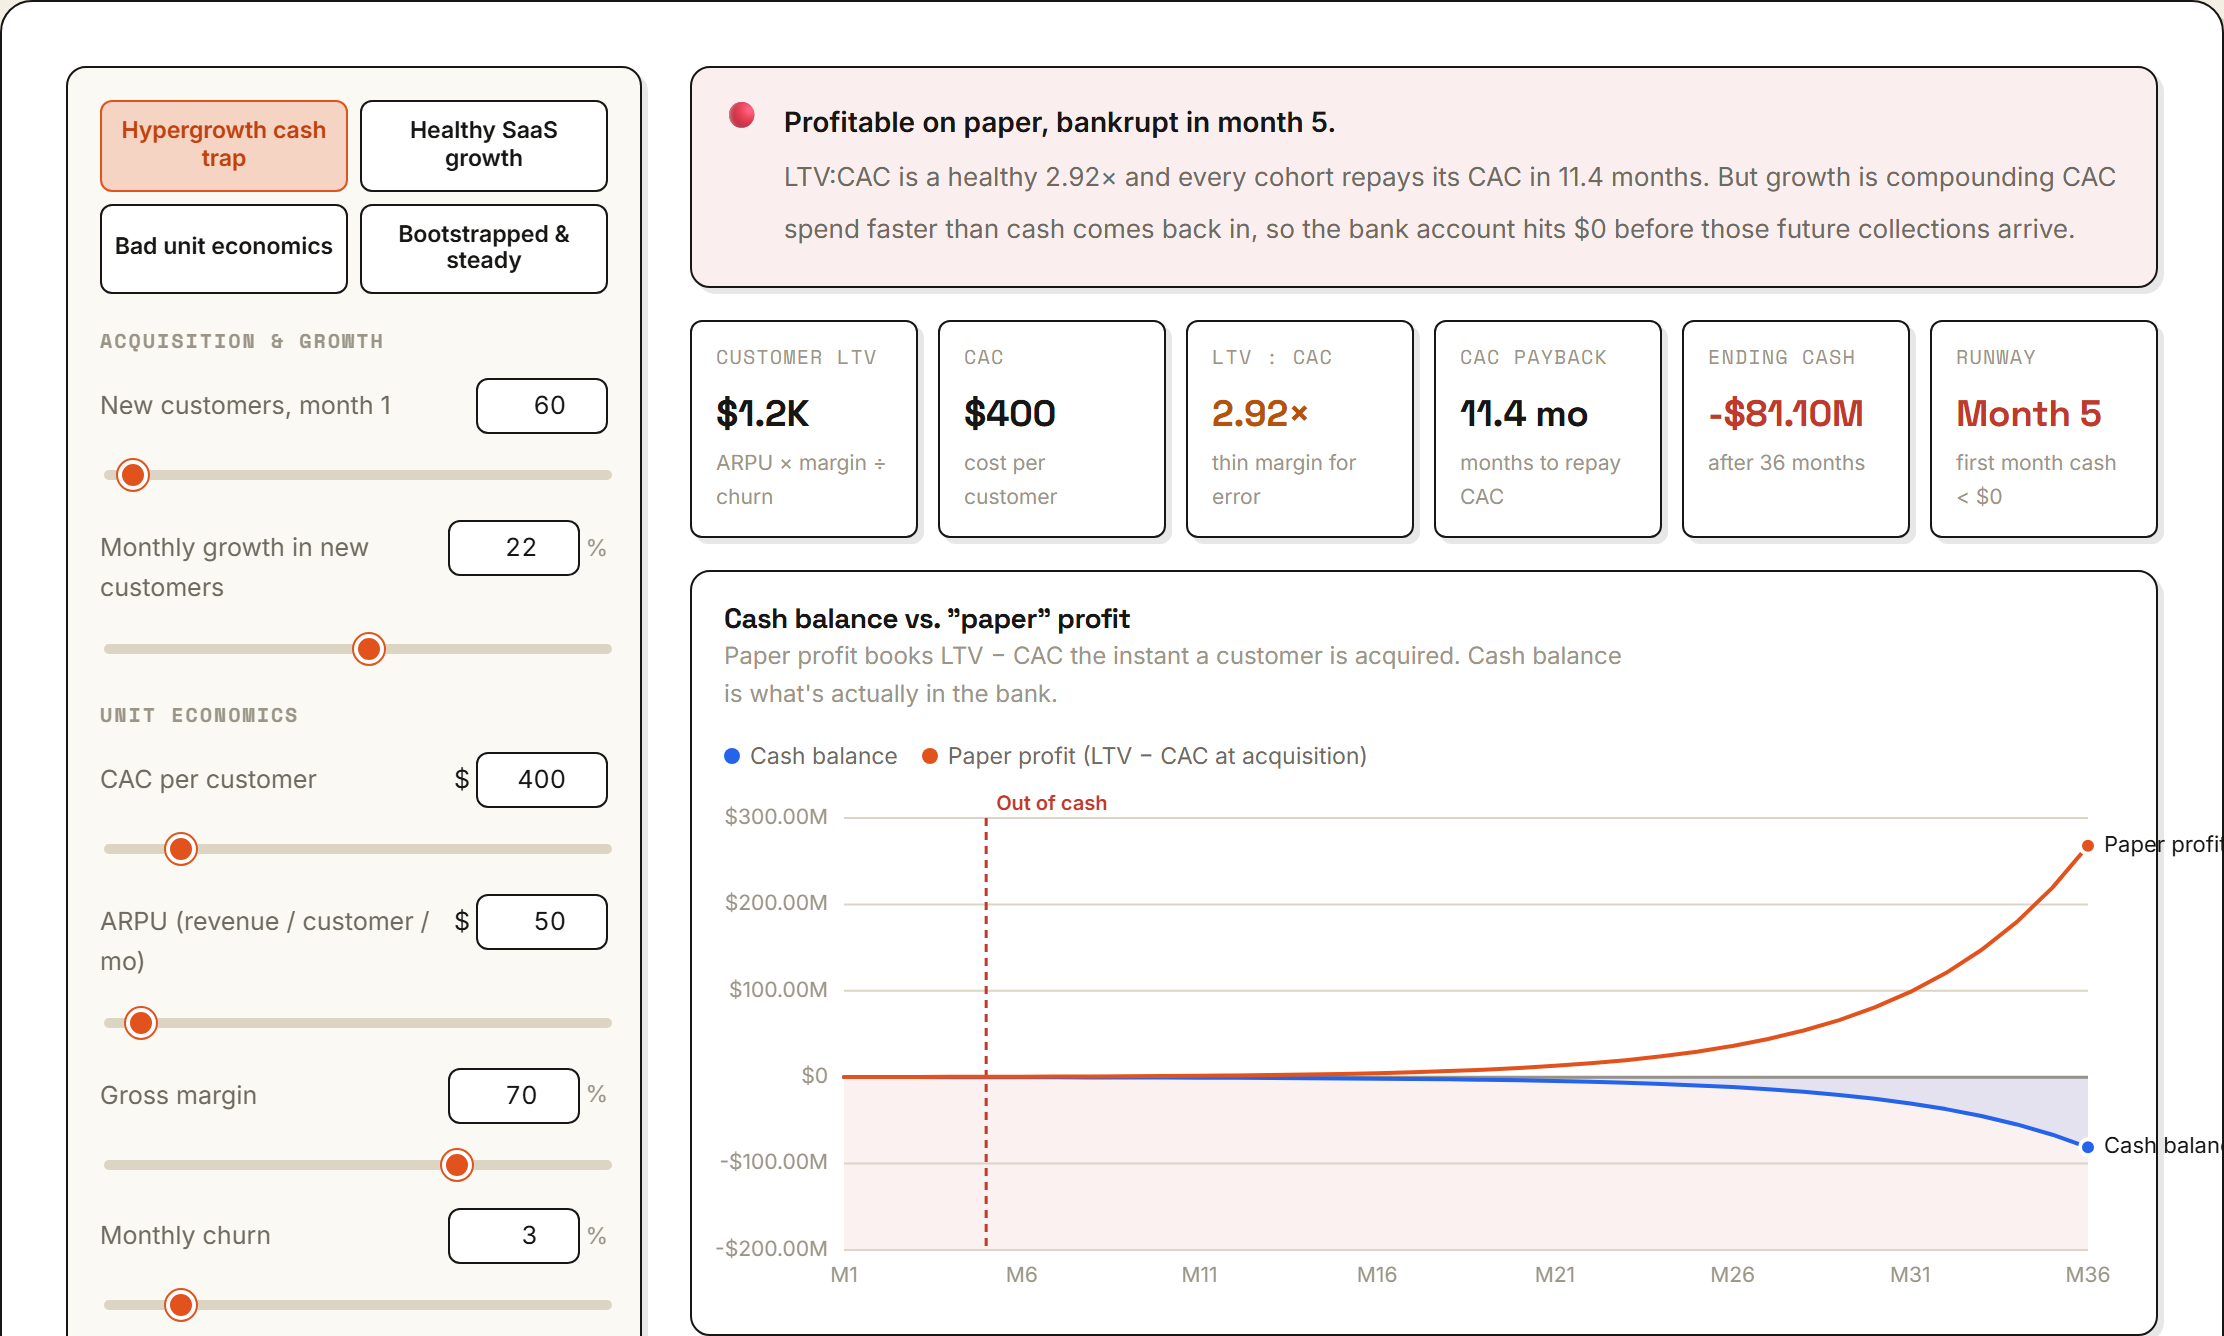
CAC vs. LTV
A month-by-month cohort simulation of a subscription business. CAC is spent in cash the day a customer is acquired; LTV is collected slowly against monthly churn. Adjust growth, unit economics, starting cash and opex — and see how a healthy LTV:CAC ratio can still empty the bank account, and when a funding round would rescue it.
Play with it →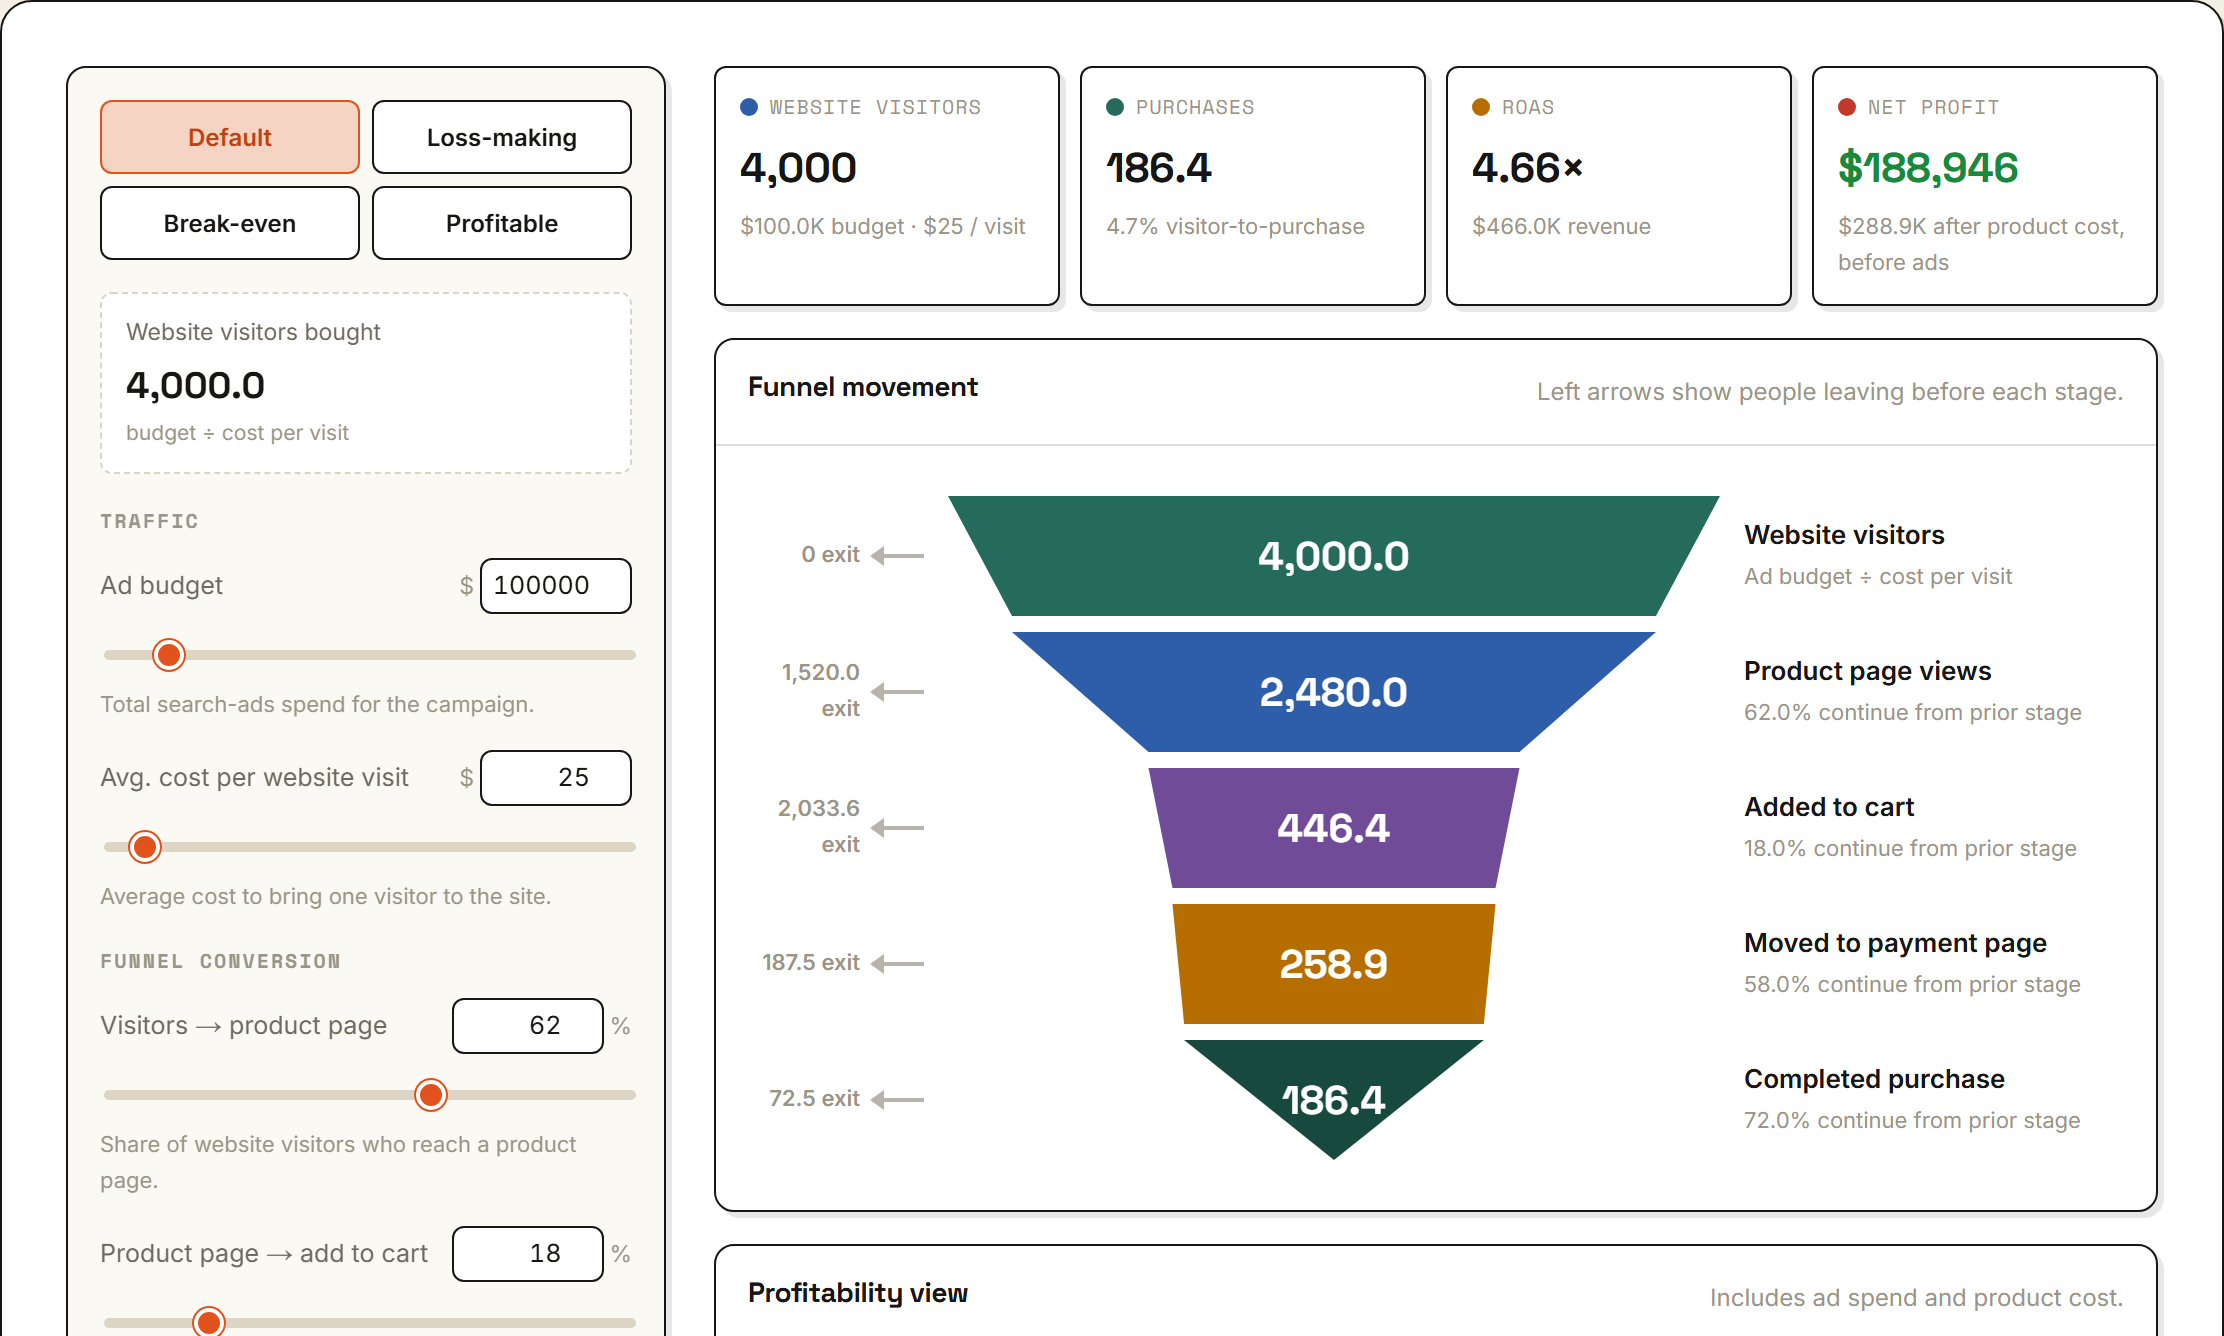
E-commerce Funnel Simulator
A search-ads e-commerce funnel from spend to profit. An ad budget and cost-per-visit buy the traffic; four sequential conversion rates (visitor → product page → cart → payment → purchase) decide how many people actually buy. See revenue, ROAS, cost per purchase, contribution margin, break-even ROAS and net profit update as you move any input — with loss-making, break-even and profitable scenarios to start from.
Play with it →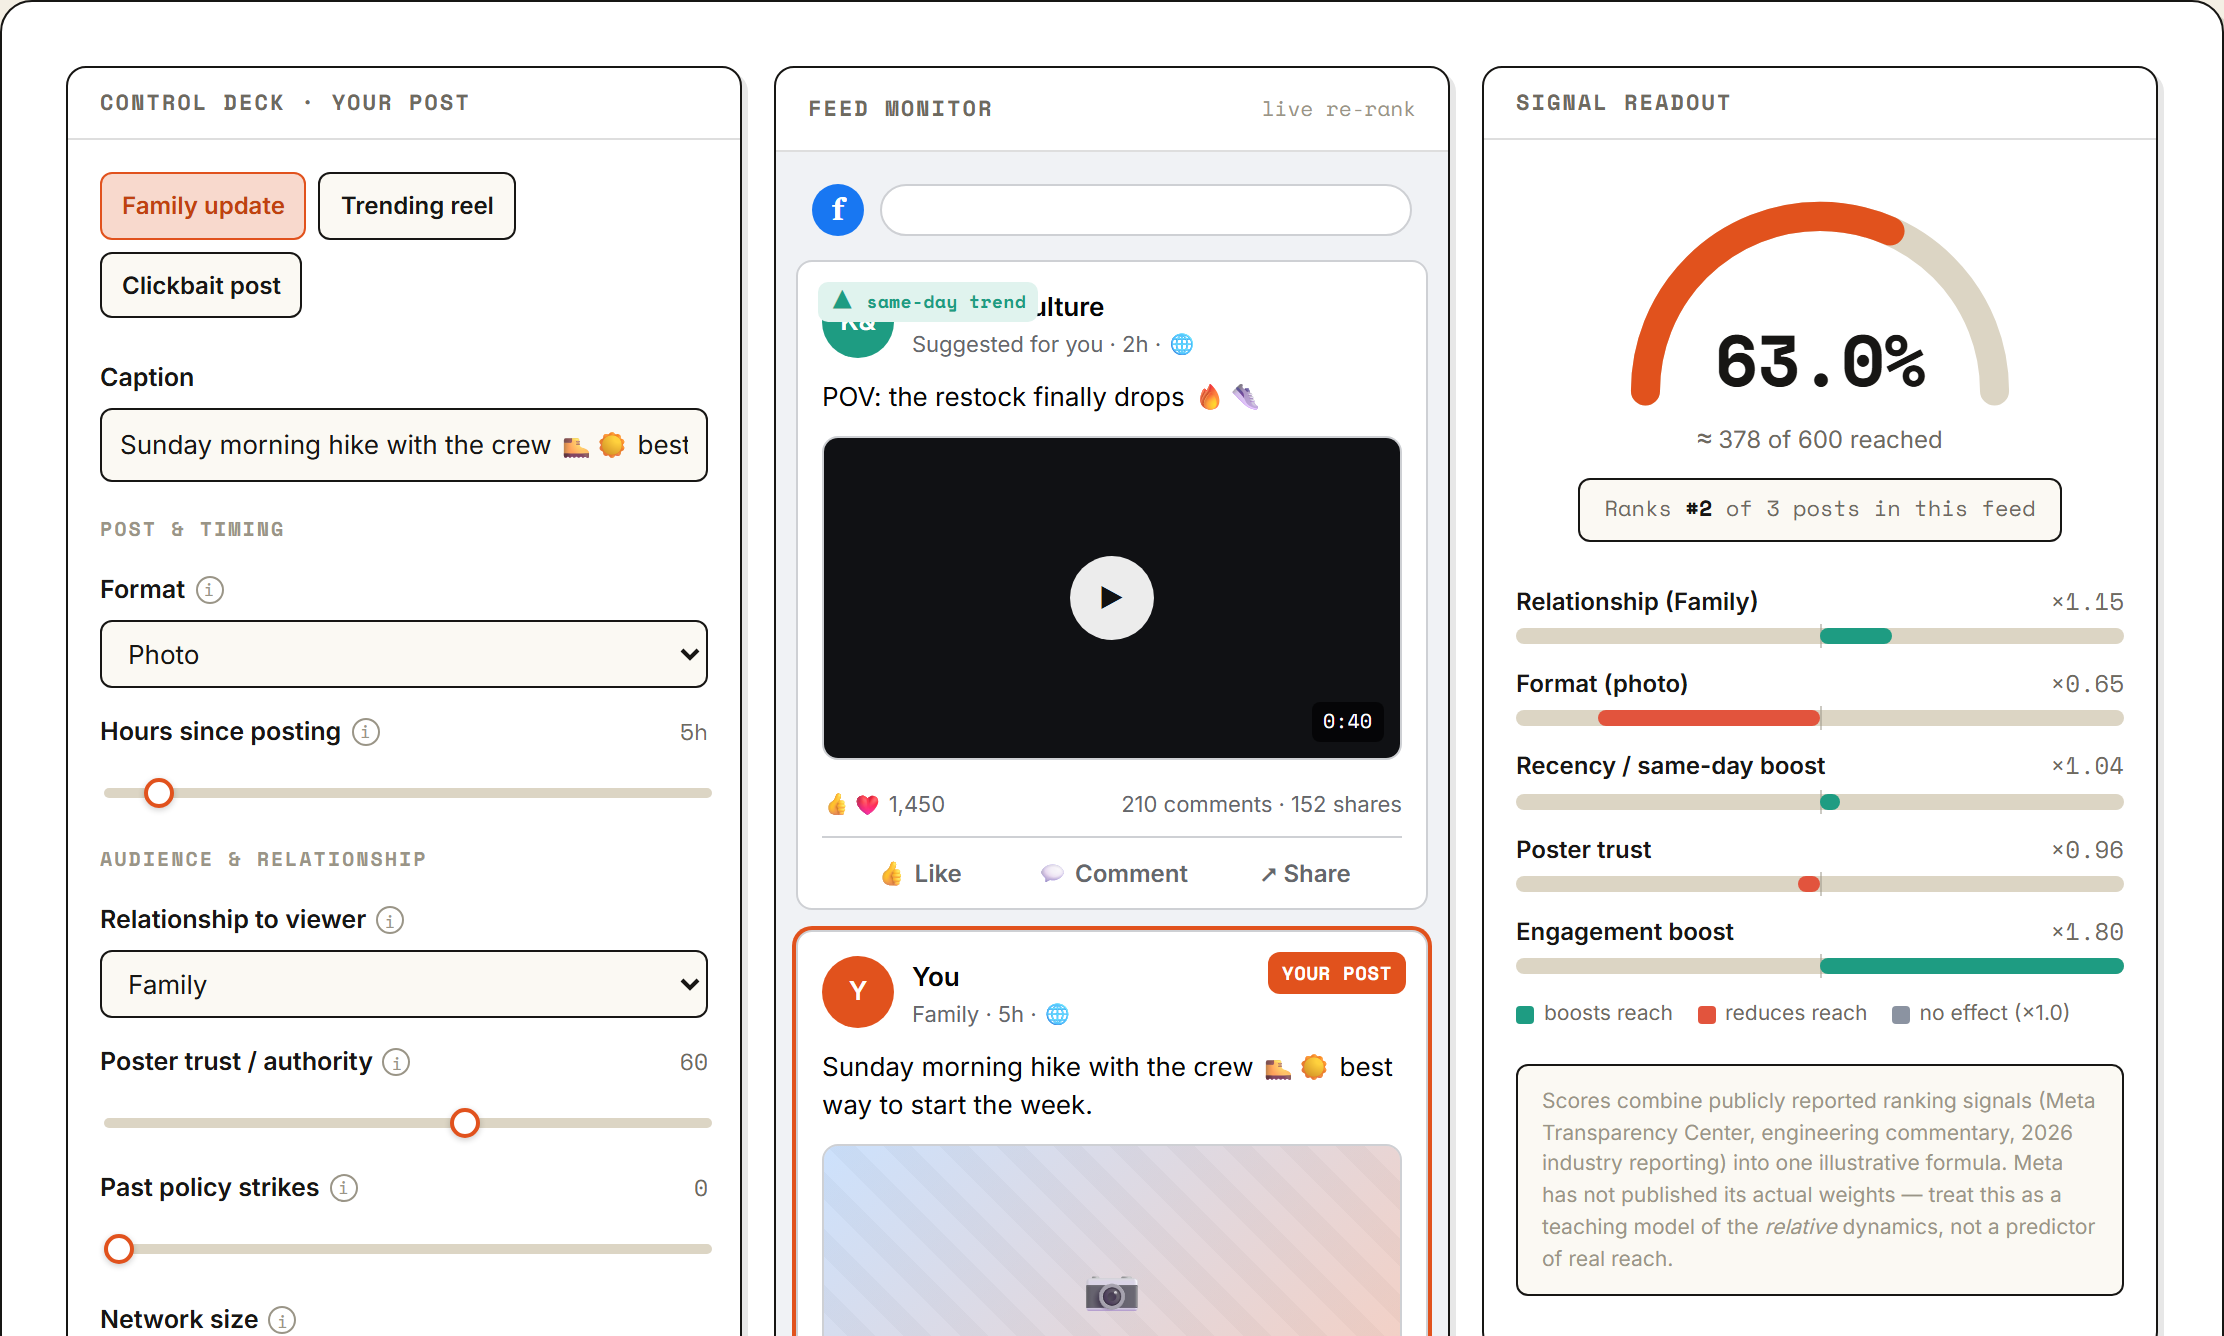
Facebook Organic Algorithm Simulator
An illustrative model of the Facebook Feed ranking signals Meta has publicly described for 2025–2026: relationship strength, format, same-day recency, poster trust, weighted engagement (private shares > comments > likes), and content-quality demotions. Tune one post's format, timing, audience and predicted engagement, watch a three-post feed re-rank live, and read a factor-by-factor breakdown of what boosted or hurt its reach. Built from public documentation — not Meta's real weights.
Play with it →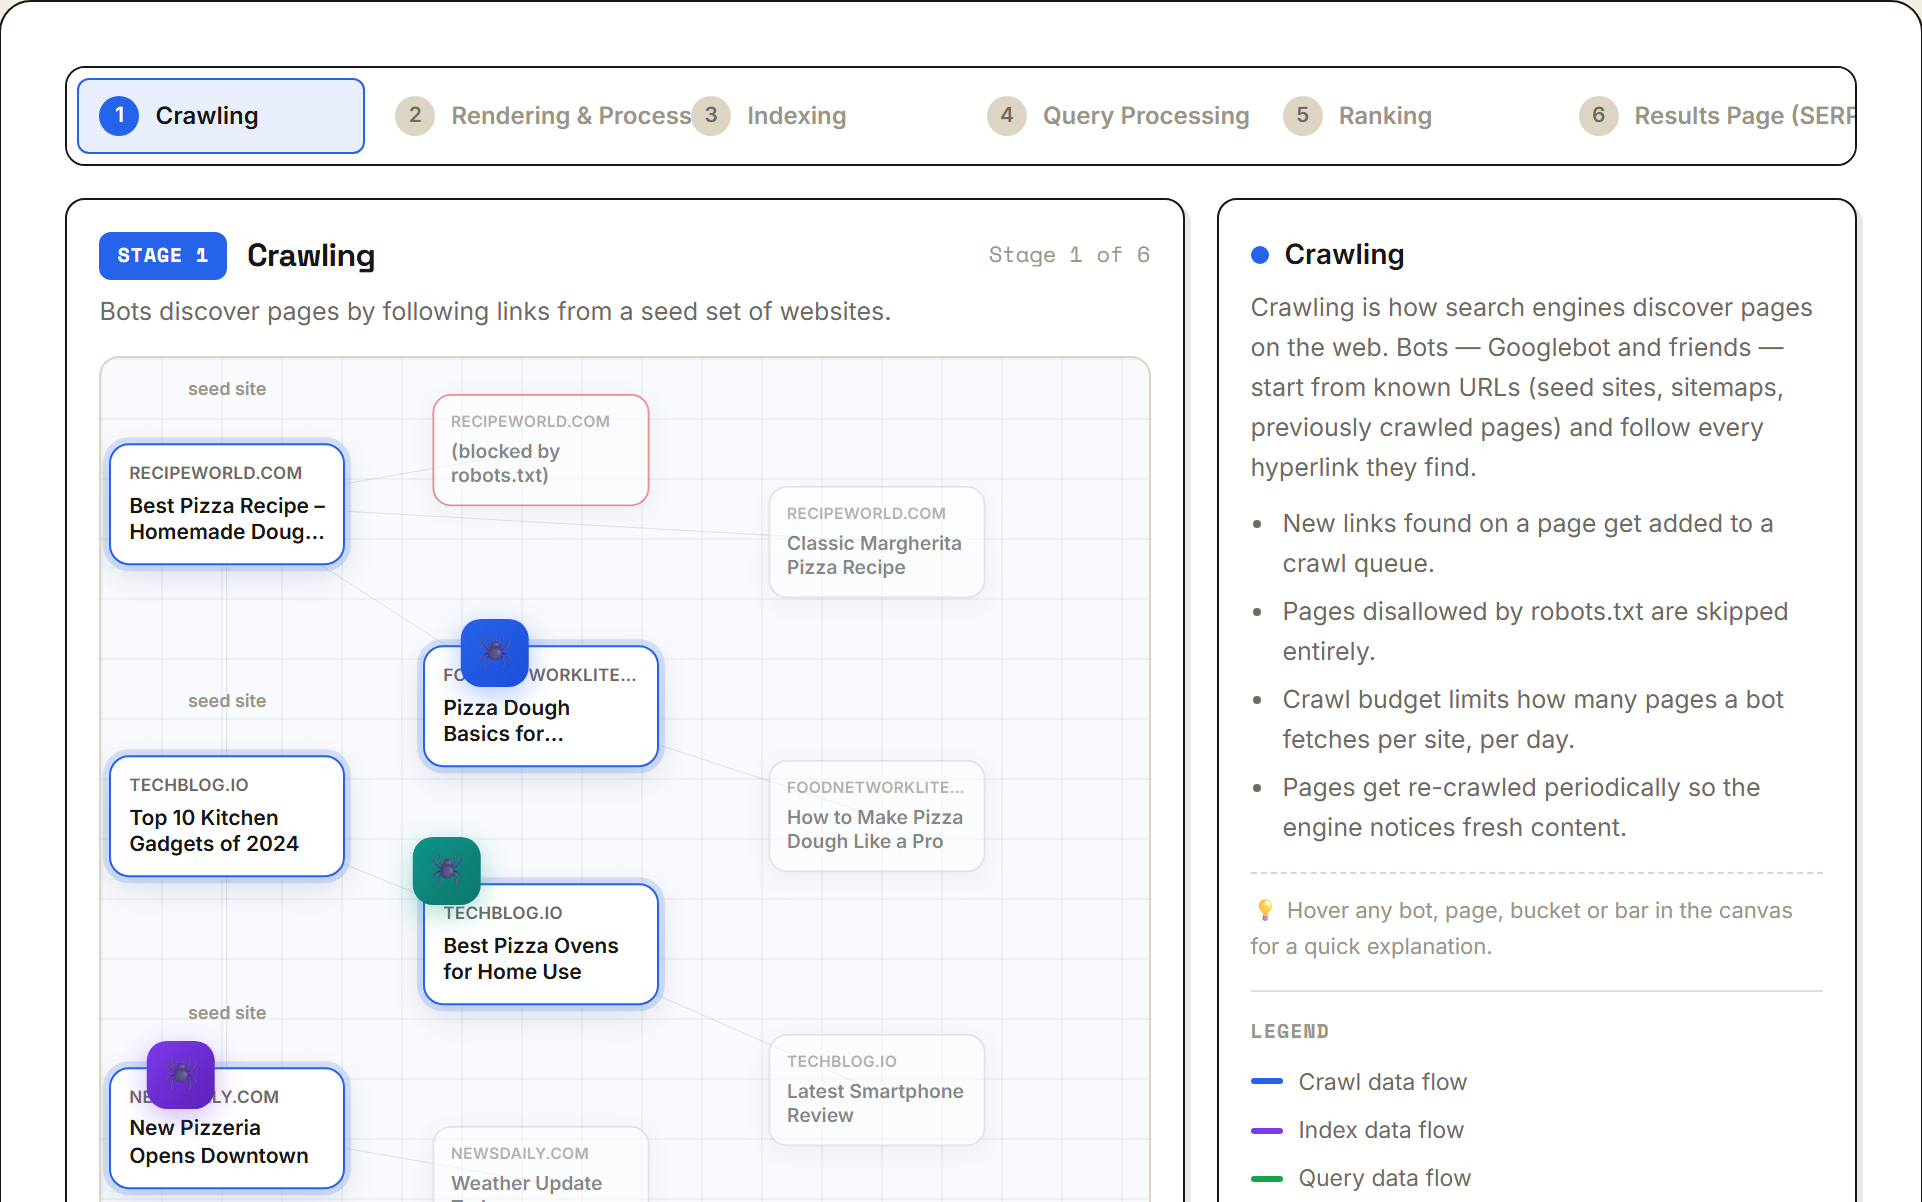
How Search Engines Work
An animated six-stage walkthrough of the pipeline behind every search: crawling (bots discover pages by following links), rendering (HTML is parsed into a DOM tree and key elements extracted), indexing (words are tokenized into an inverted index), query processing (a search is corrected, expanded and matched to candidates), ranking (candidates are scored on relevance, authority, speed, mobile, freshness and engagement, then sorted), and the SERP (the sorted list is assembled with featured snippet and 'people also ask'). Step through it or press play. Illustrative model — not any engine's real weights.
Play with it →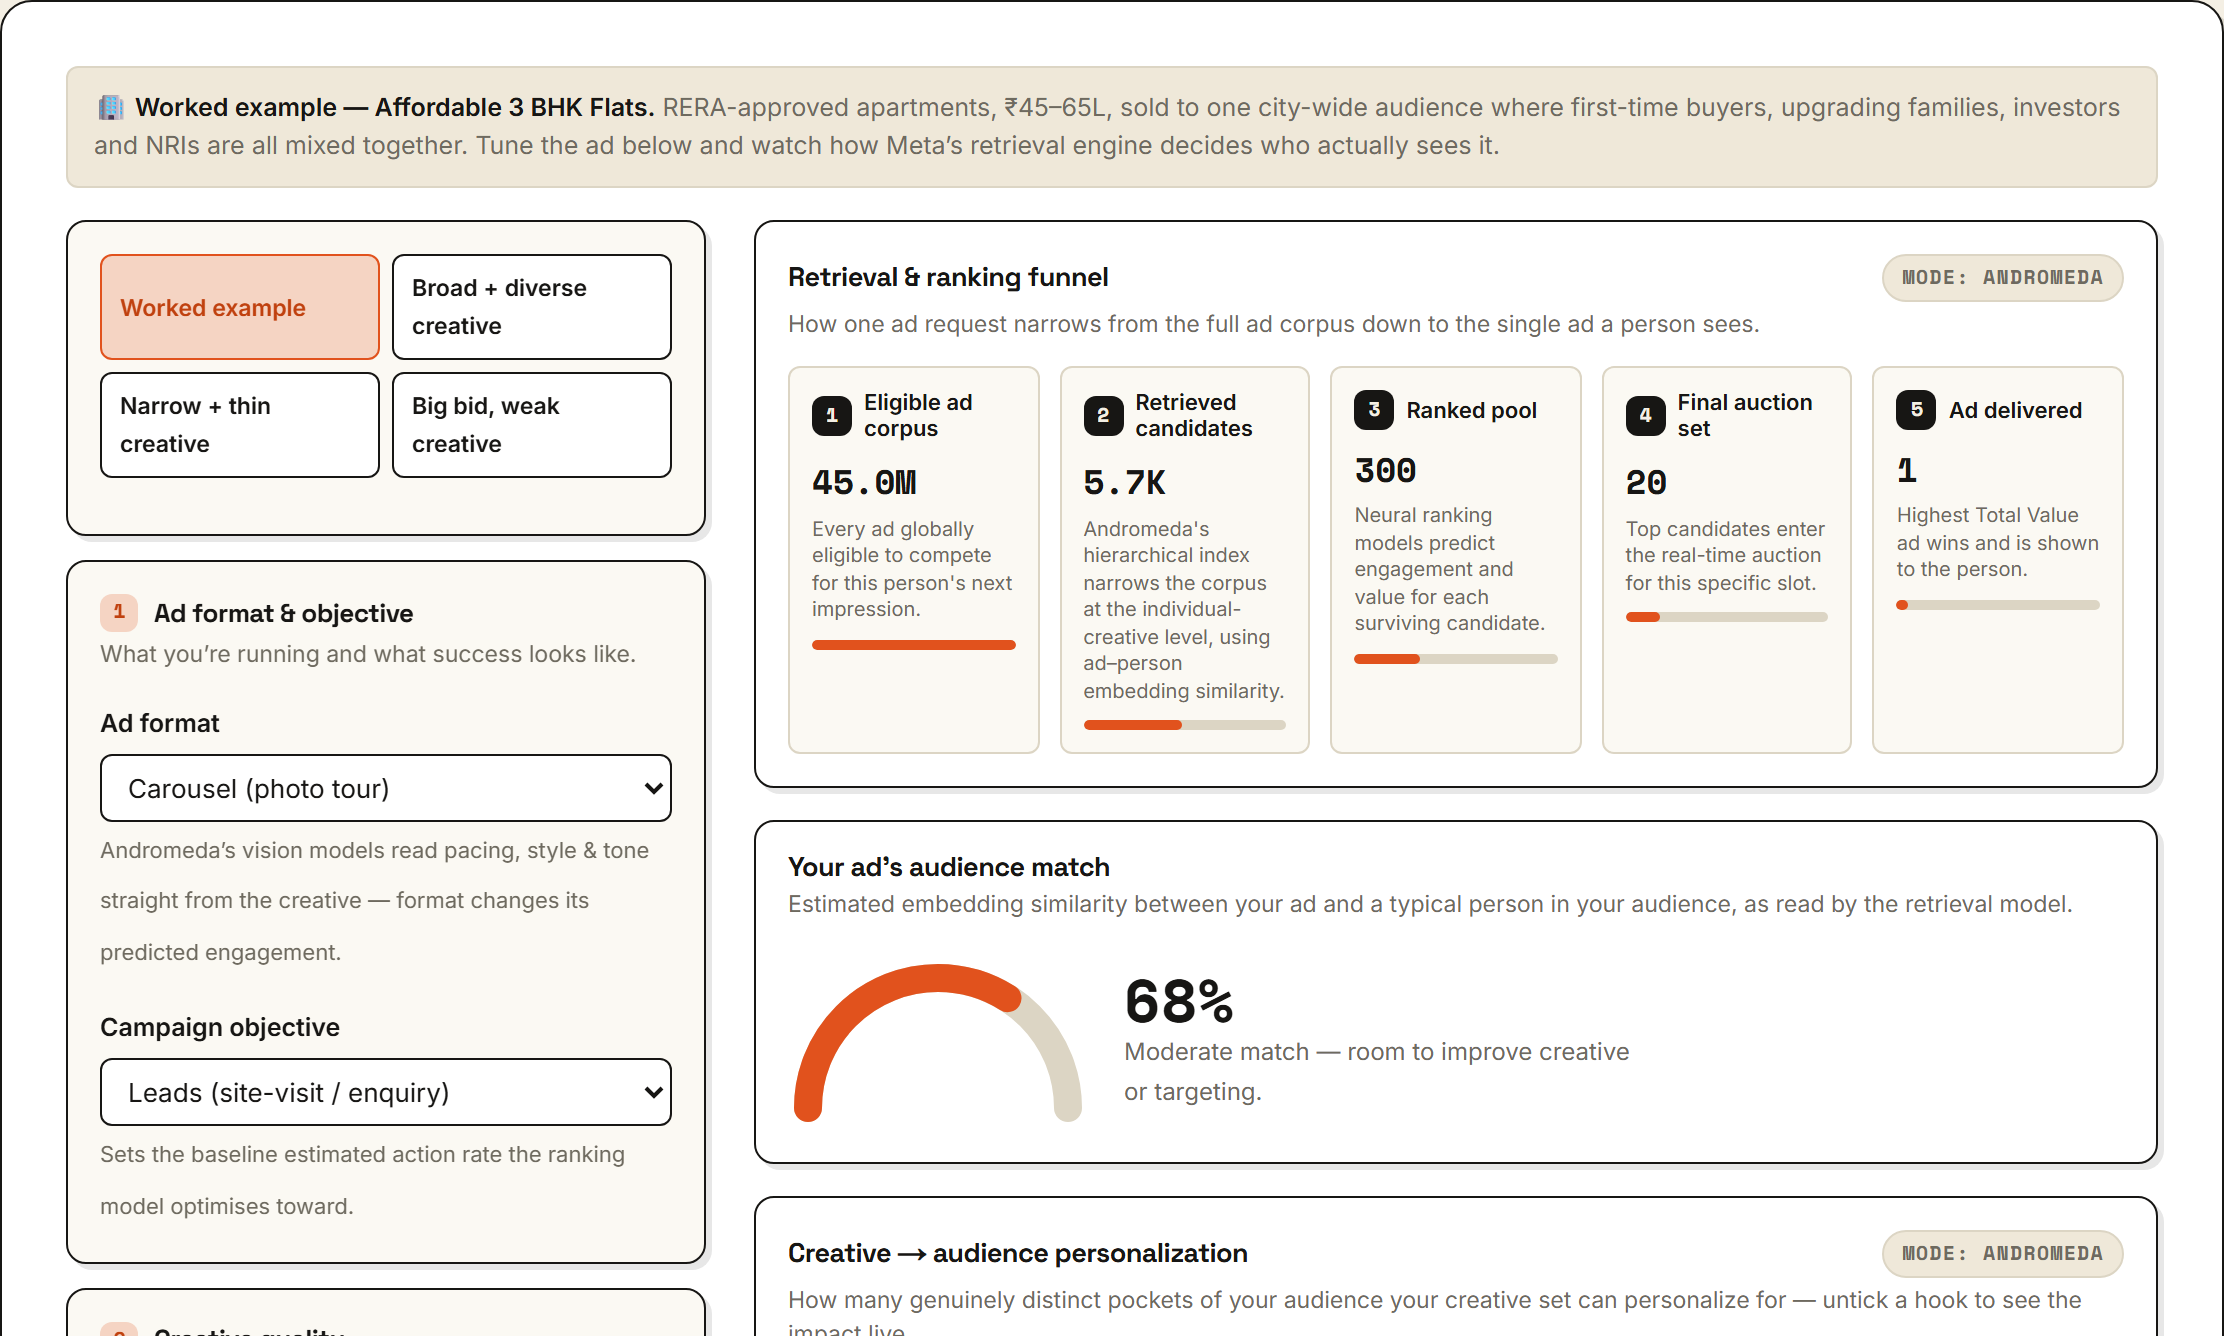
Meta Andromeda Ads Algorithm Simulator
An illustrative model of Meta Andromeda — the retrieval stage in front of ad ranking, the auction and delivery pacing that powers Advantage+. Using a worked example (affordable 3 BHK flats sold to one mixed city-wide audience), set format, objective, creative quality, hook diversity, audience breadth, bid and budget, then watch the retrieval-and-ranking funnel, an embedding match gauge, per-creative 'entity' coverage, relevance diagnostics, a sample Total-Value auction and a Monte-Carlo daily dashboard all recompute live. Flip between Andromeda and legacy two-tower retrieval to see how much of the result depends on the engine itself. Built from Meta's public engineering write-ups and third-party analysis — not Meta's real weights.
Play with it →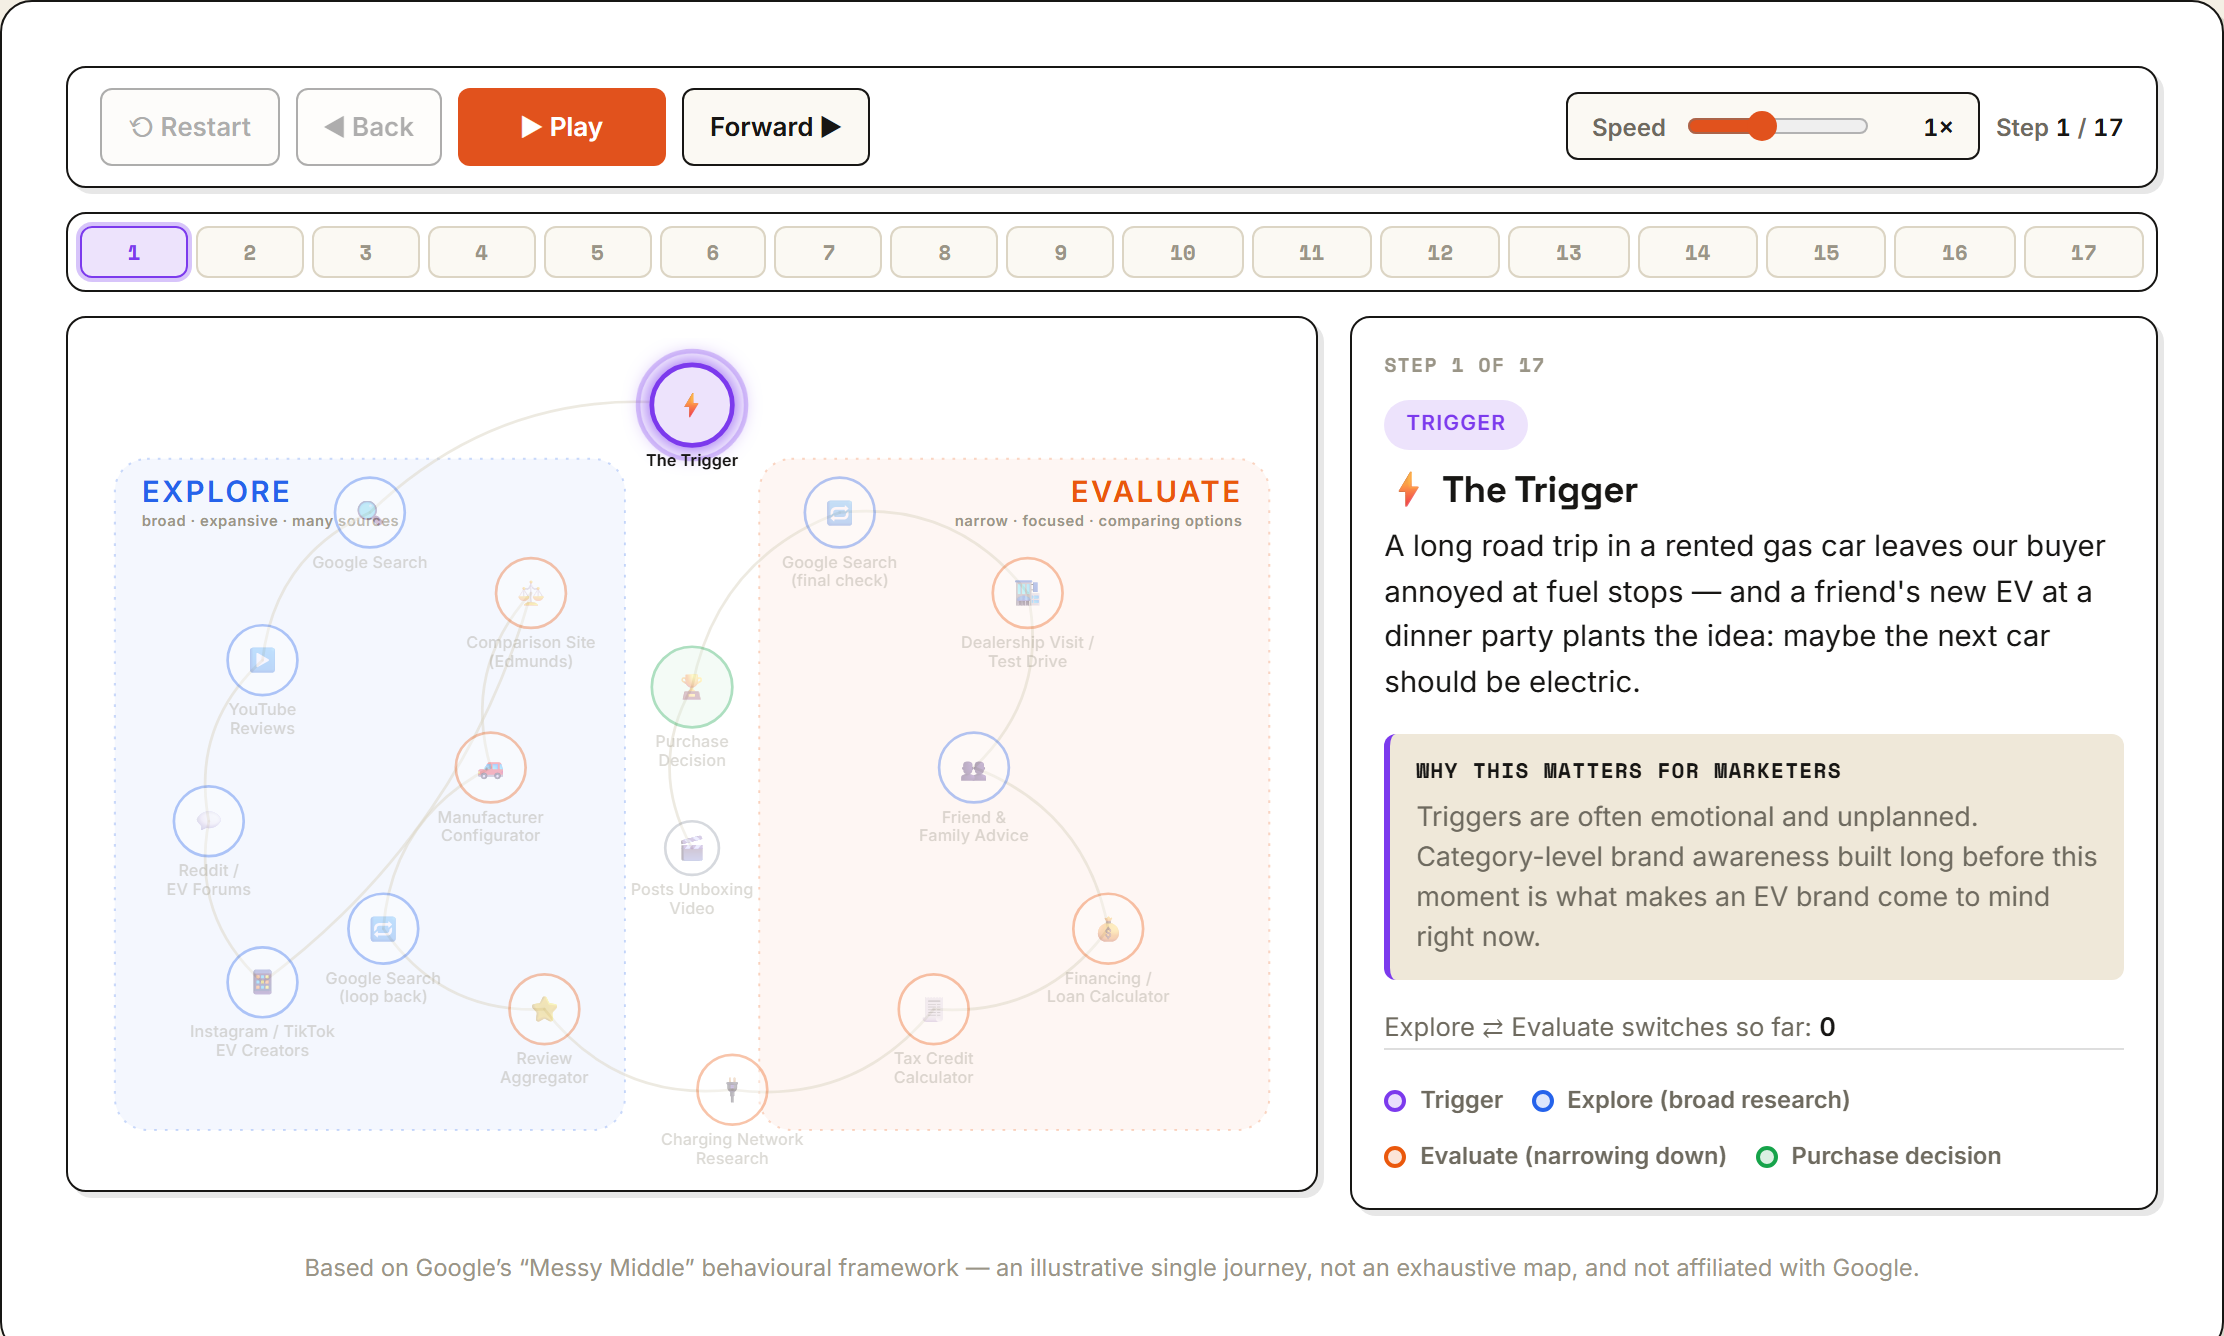
The Messy Middle
An animated walkthrough of Google's 'Messy Middle' framework: the space between a purchase trigger and the decision, where a buyer doesn't move in a straight line but loops back and forth between broad exploration (search, YouTube, Reddit, social) and focused evaluation (comparison sites, configurators, reviews, charging maps, incentive and finance calculators, a test drive). Step through a 17-touchpoint EV journey or press play; each stop shows what the buyer is doing, why it matters for marketers, and a running count of how many times they've crossed between the two mindsets. Illustrative single journey, not an exhaustive map.
Play with it →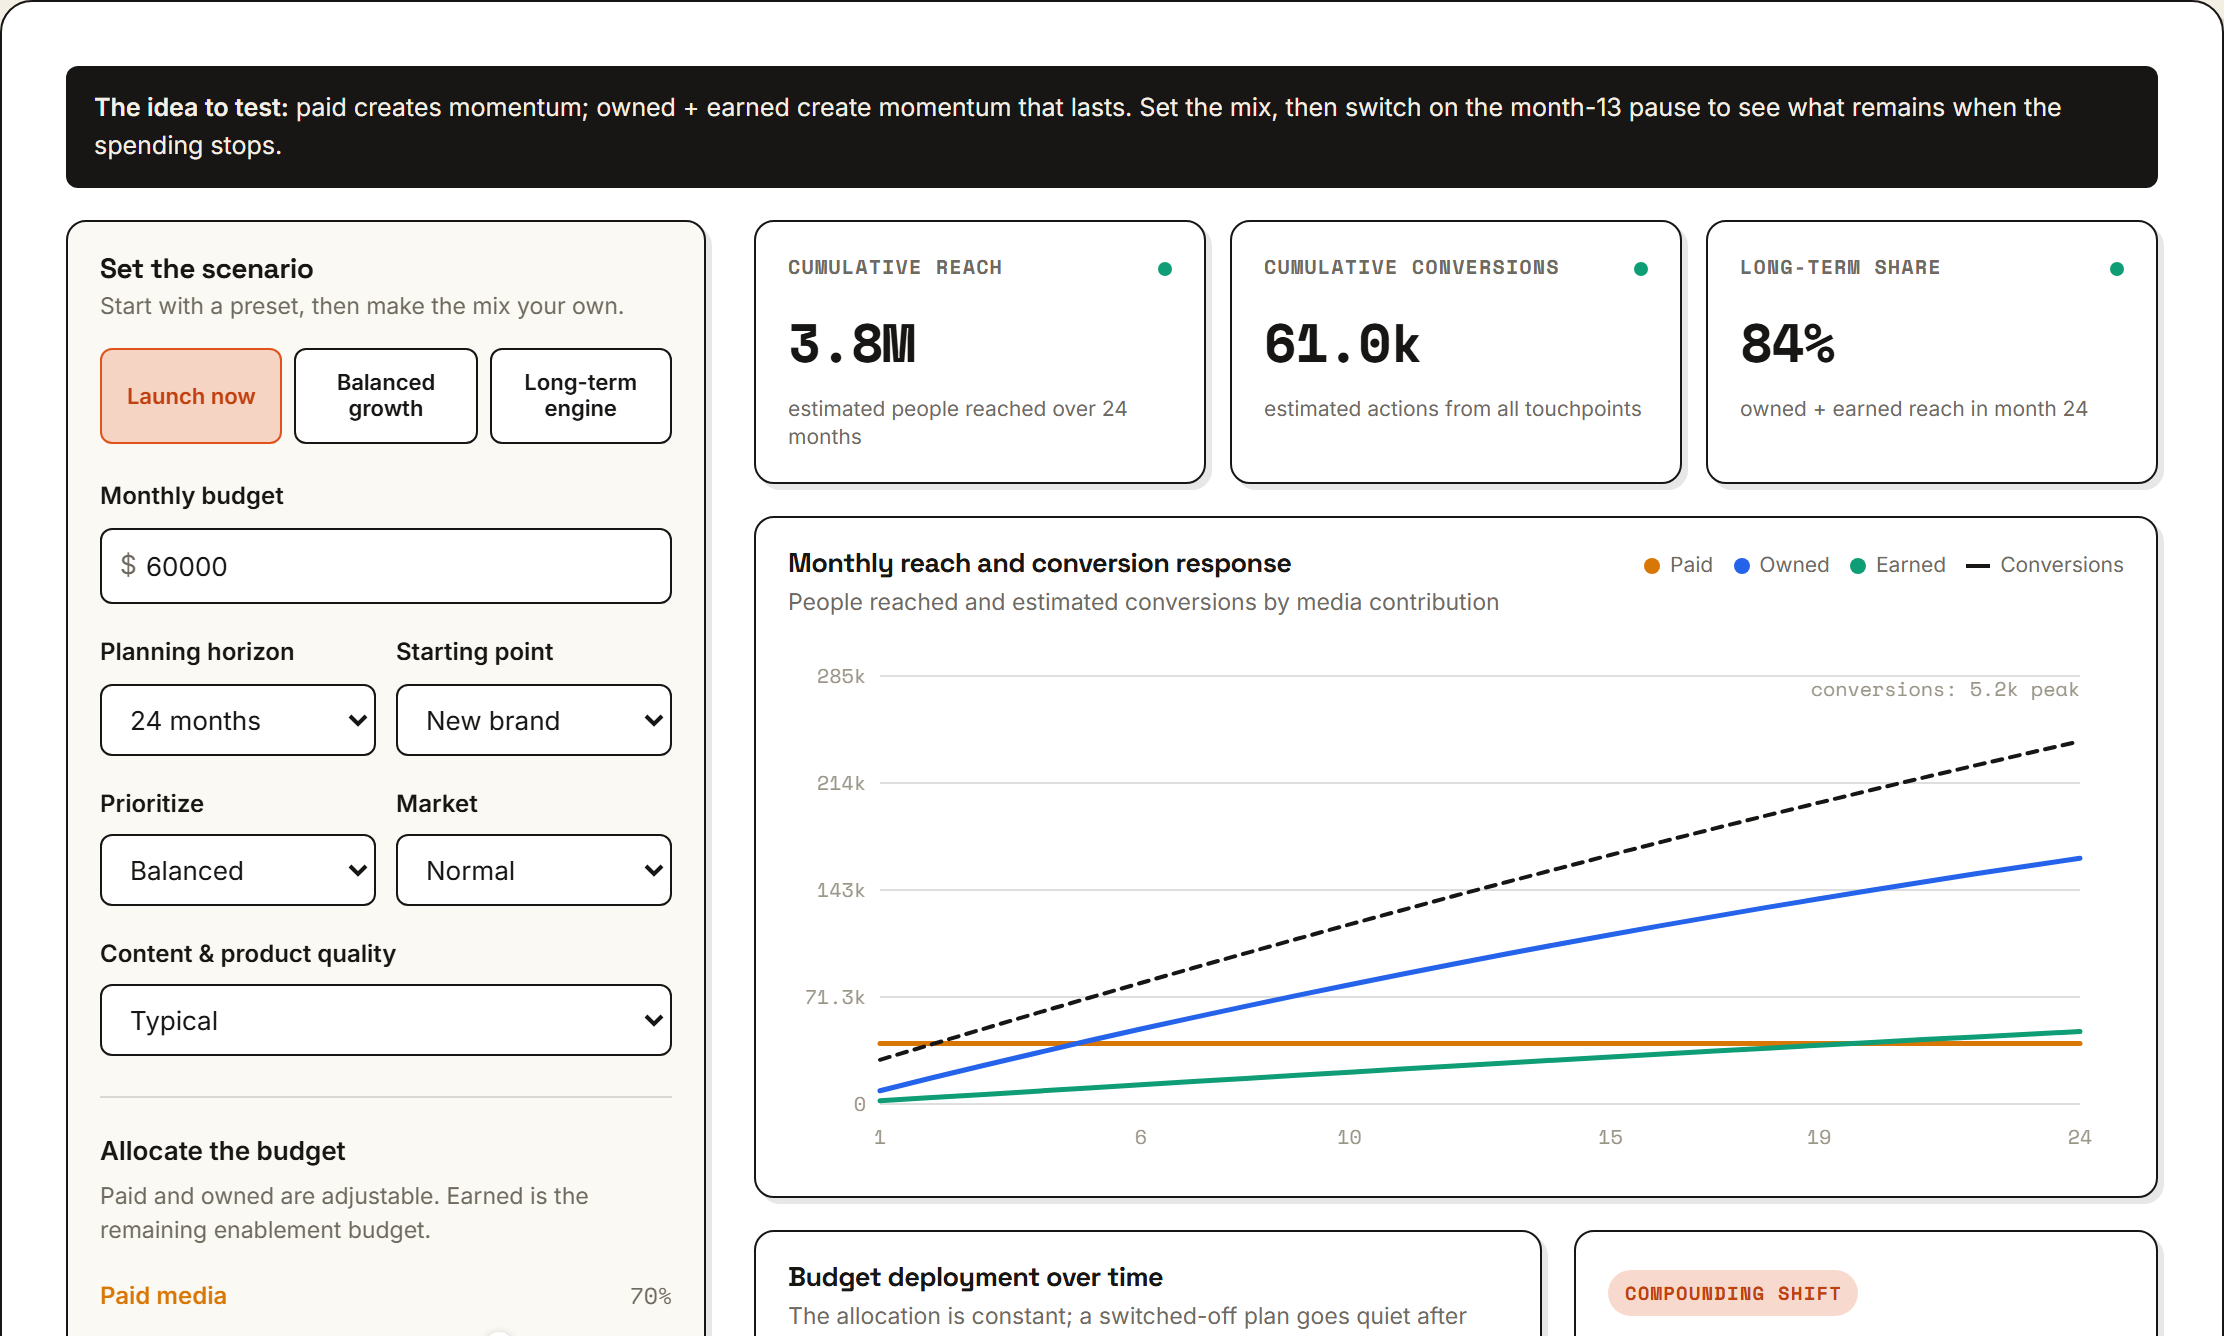
POEM Growth Simulator
An illustrative scenario model of the Paid / Owned / Earned media framework over time. Set a monthly budget, planning horizon, starting point, priority, market and content quality, then slide the paid vs. owned split (earned is the remaining enablement budget). A month-by-month simulation shows reach by channel and estimated conversions, budget deployment, and a narrative read on whether the plan is a fast launch or a durable growth engine. Flip on the month-13 spend pause to see what owned assets and earned credibility keep delivering once paid stops. Teaching model of the trade-off — not a media forecast.
Play with it →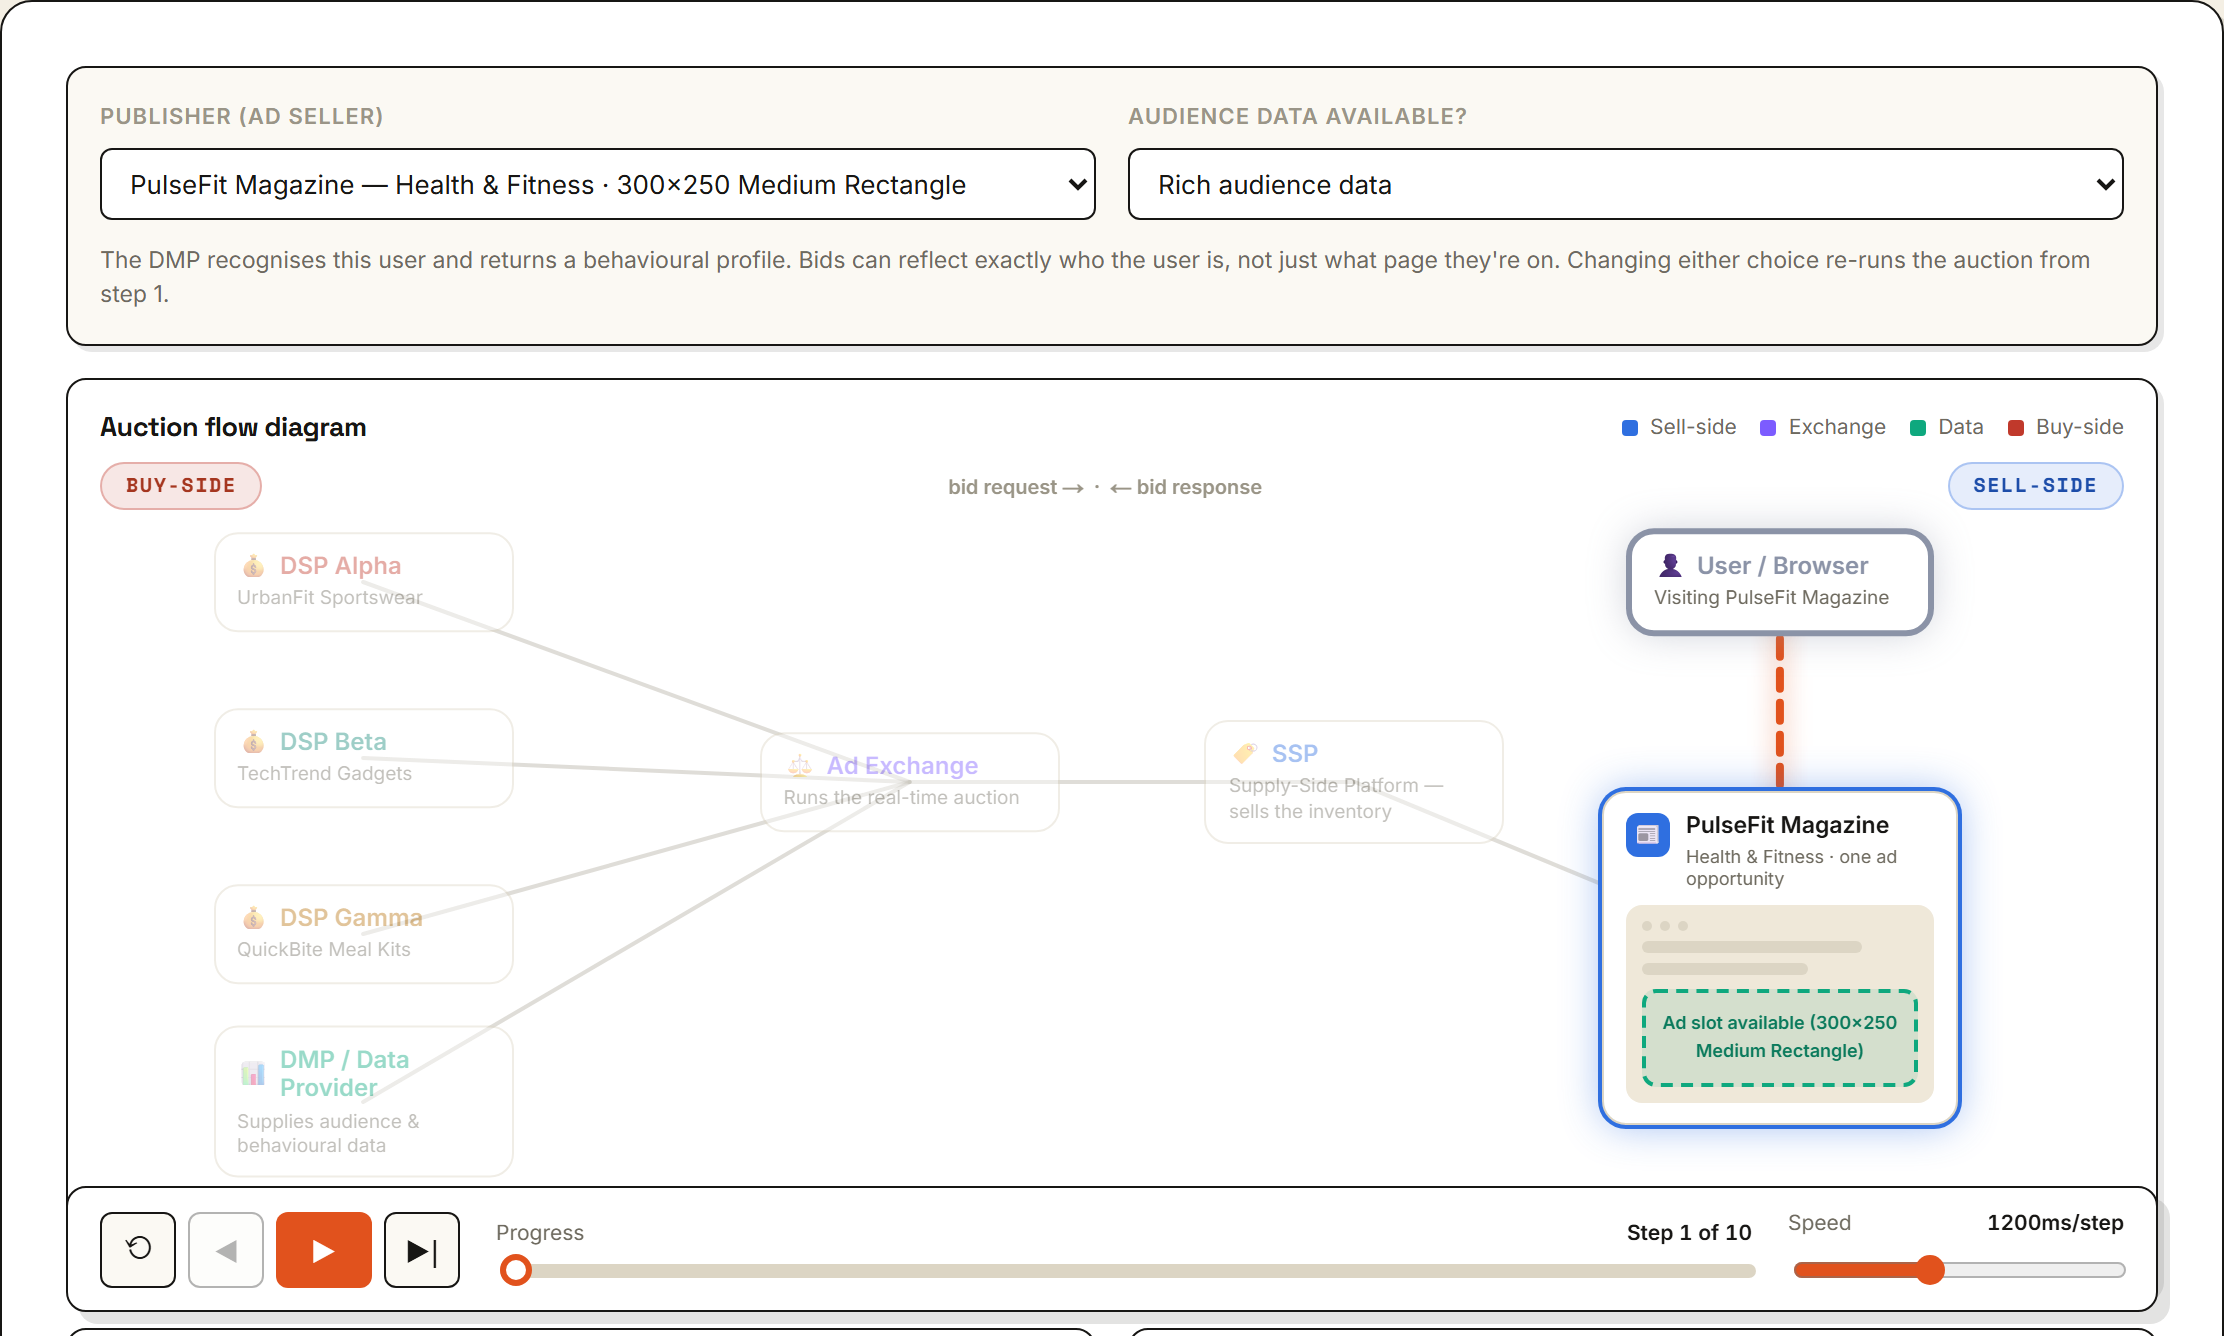
Display Programmatic Advertising
An animated 10-step walkthrough of a real-time bidding (RTB) auction — the automated process between a page loading and an ad appearing. Pick a publisher and whether the ad exchange has audience data, then step (or play) through the flow: the page opens an ad slot, the SSP sends a bid request, the exchange enriches it from a DMP, three DSPs each evaluate and bid for their advertiser, a second-price auction picks the winner and clearing price, and the winning creative is served back and rendered. A flow diagram, a live bid board, an event timeline and a glossary update at every step. Fictional players and bid values — illustrative of RTB mechanics only.
Play with it →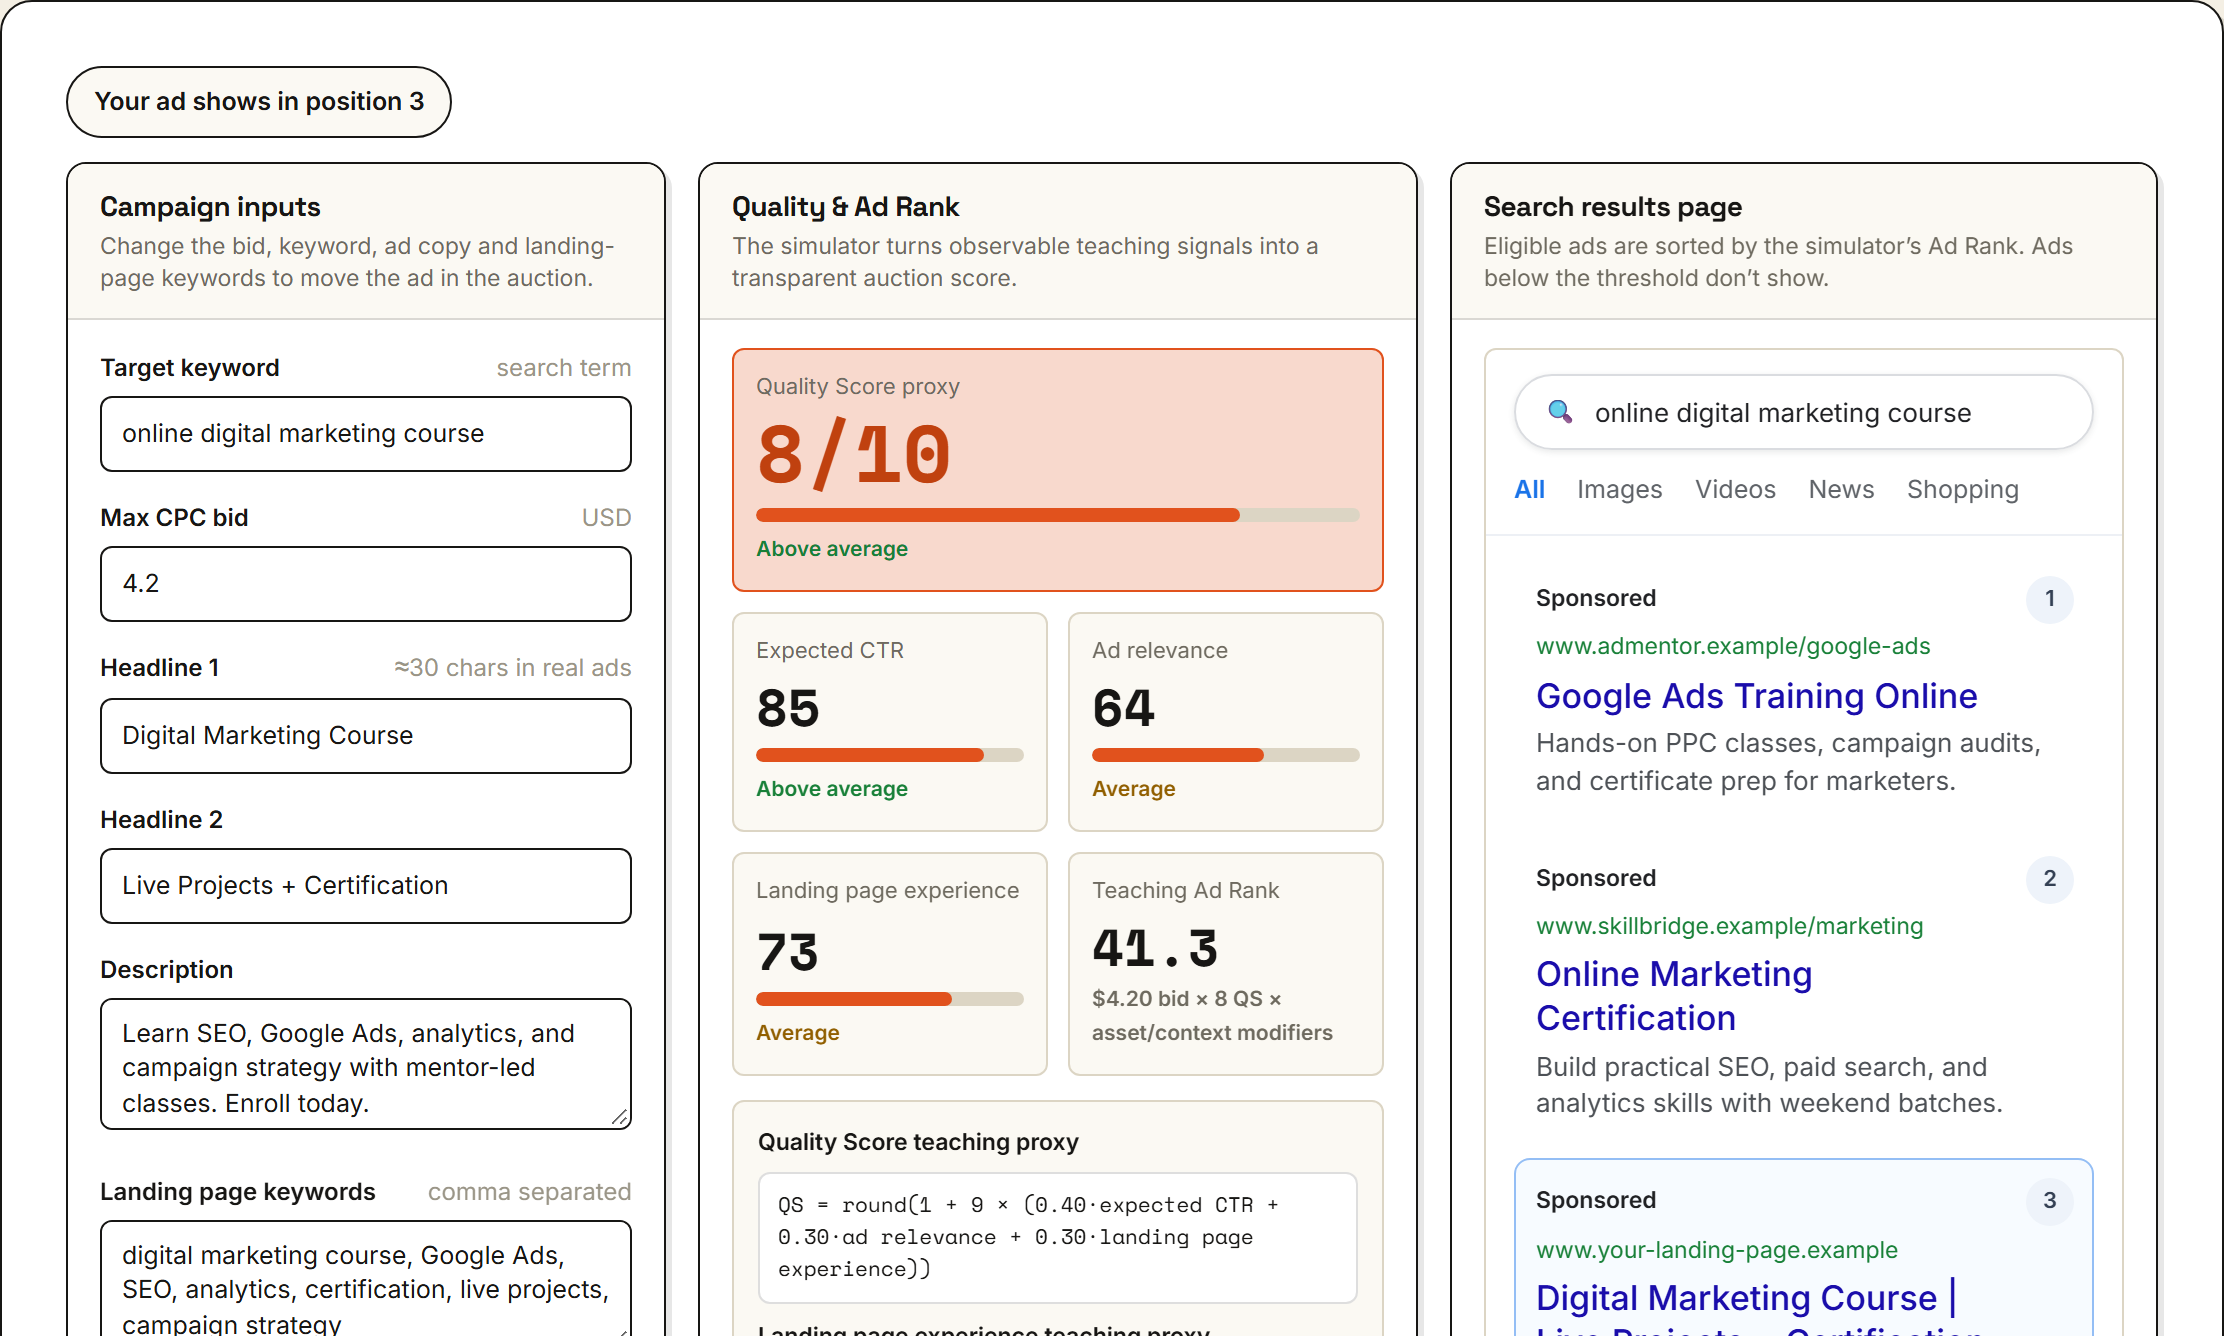
Search Ad Auction Simulator
A teaching model of the Google-style search ads auction. Write an ad — keyword, bid, headlines, description, landing-page keywords, load time, mobile, assets — and watch a transparent proxy turn those signals into Expected CTR, Ad relevance, Landing page experience and a 1–10 Quality Score, then into a teaching Ad Rank (bid × QS × asset & competitiveness modifiers). Your ad is ranked live against four fixed competitors on a mock results page, with a display threshold that a low bid or low quality can both fail. Shows why a higher-quality lower bid can outrank a weaker higher bid. A teaching proxy, not Google's real auction or weights.
Play with it →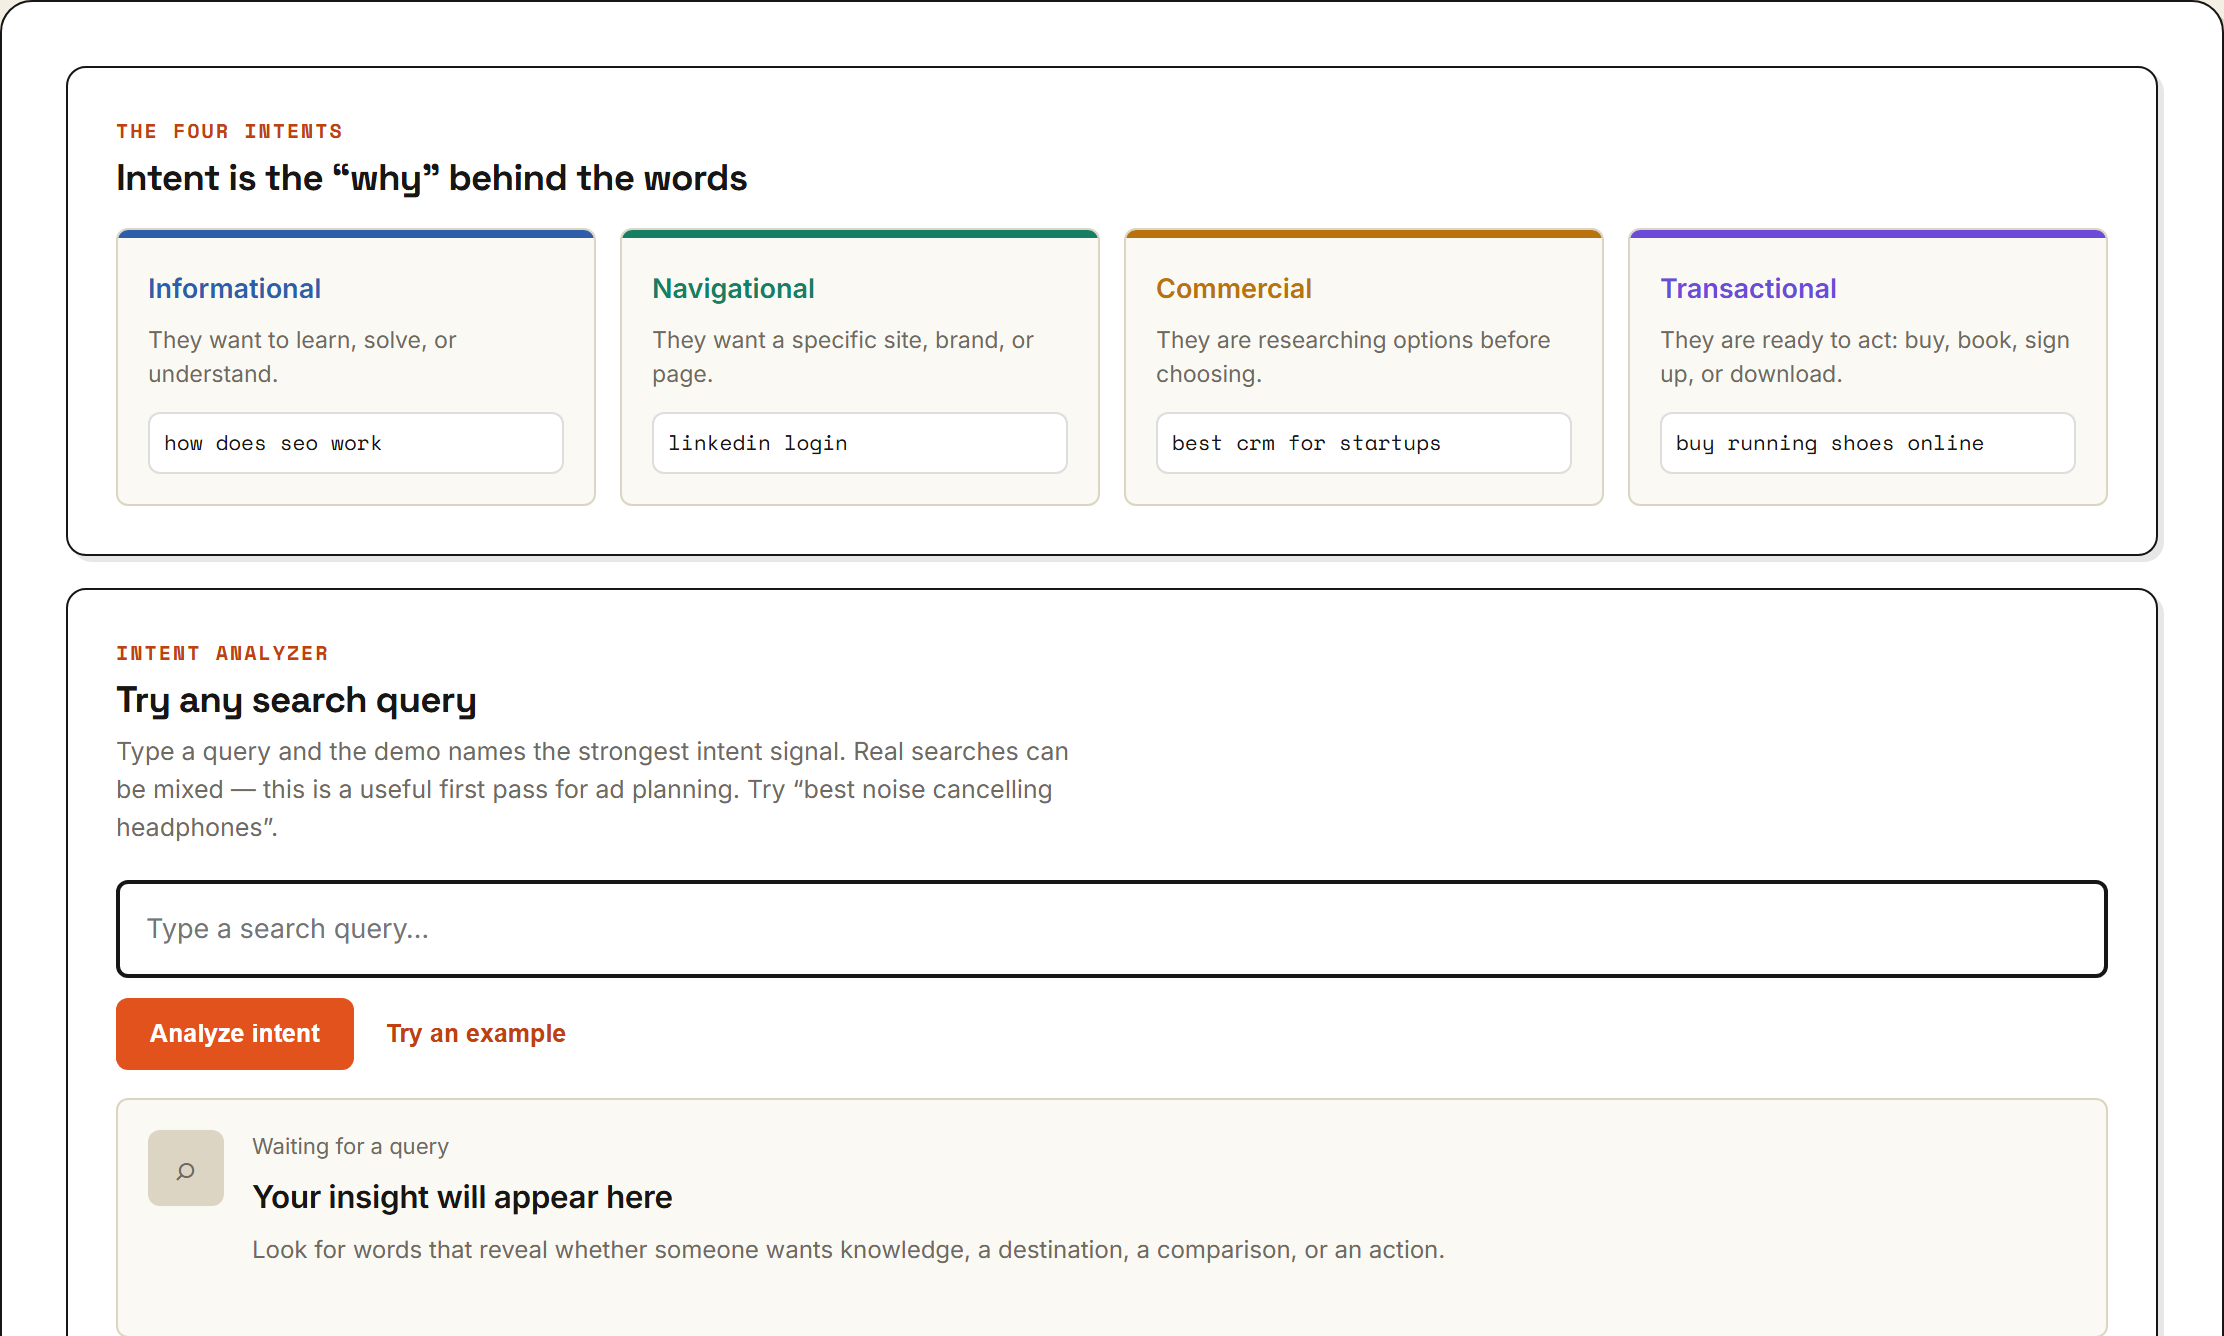
Search Intent Classifier
A keyword-rule teaching model of the four classic search intents: informational (learn or solve), navigational (reach a specific site), commercial (research options), and transactional (ready to act). Type any query into the analyzer and it names the strongest intent signal, highlighting the words that drove the call; a five-question quiz tests your read of new queries; and a 'wording effect' panel puts near-identical searches side by side to show how adding 'buy', 'best', a price or a place moves the searcher from one stage to the next. A first-pass heuristic — real searches are often mixed, and human context beats a keyword rule.
Play with it →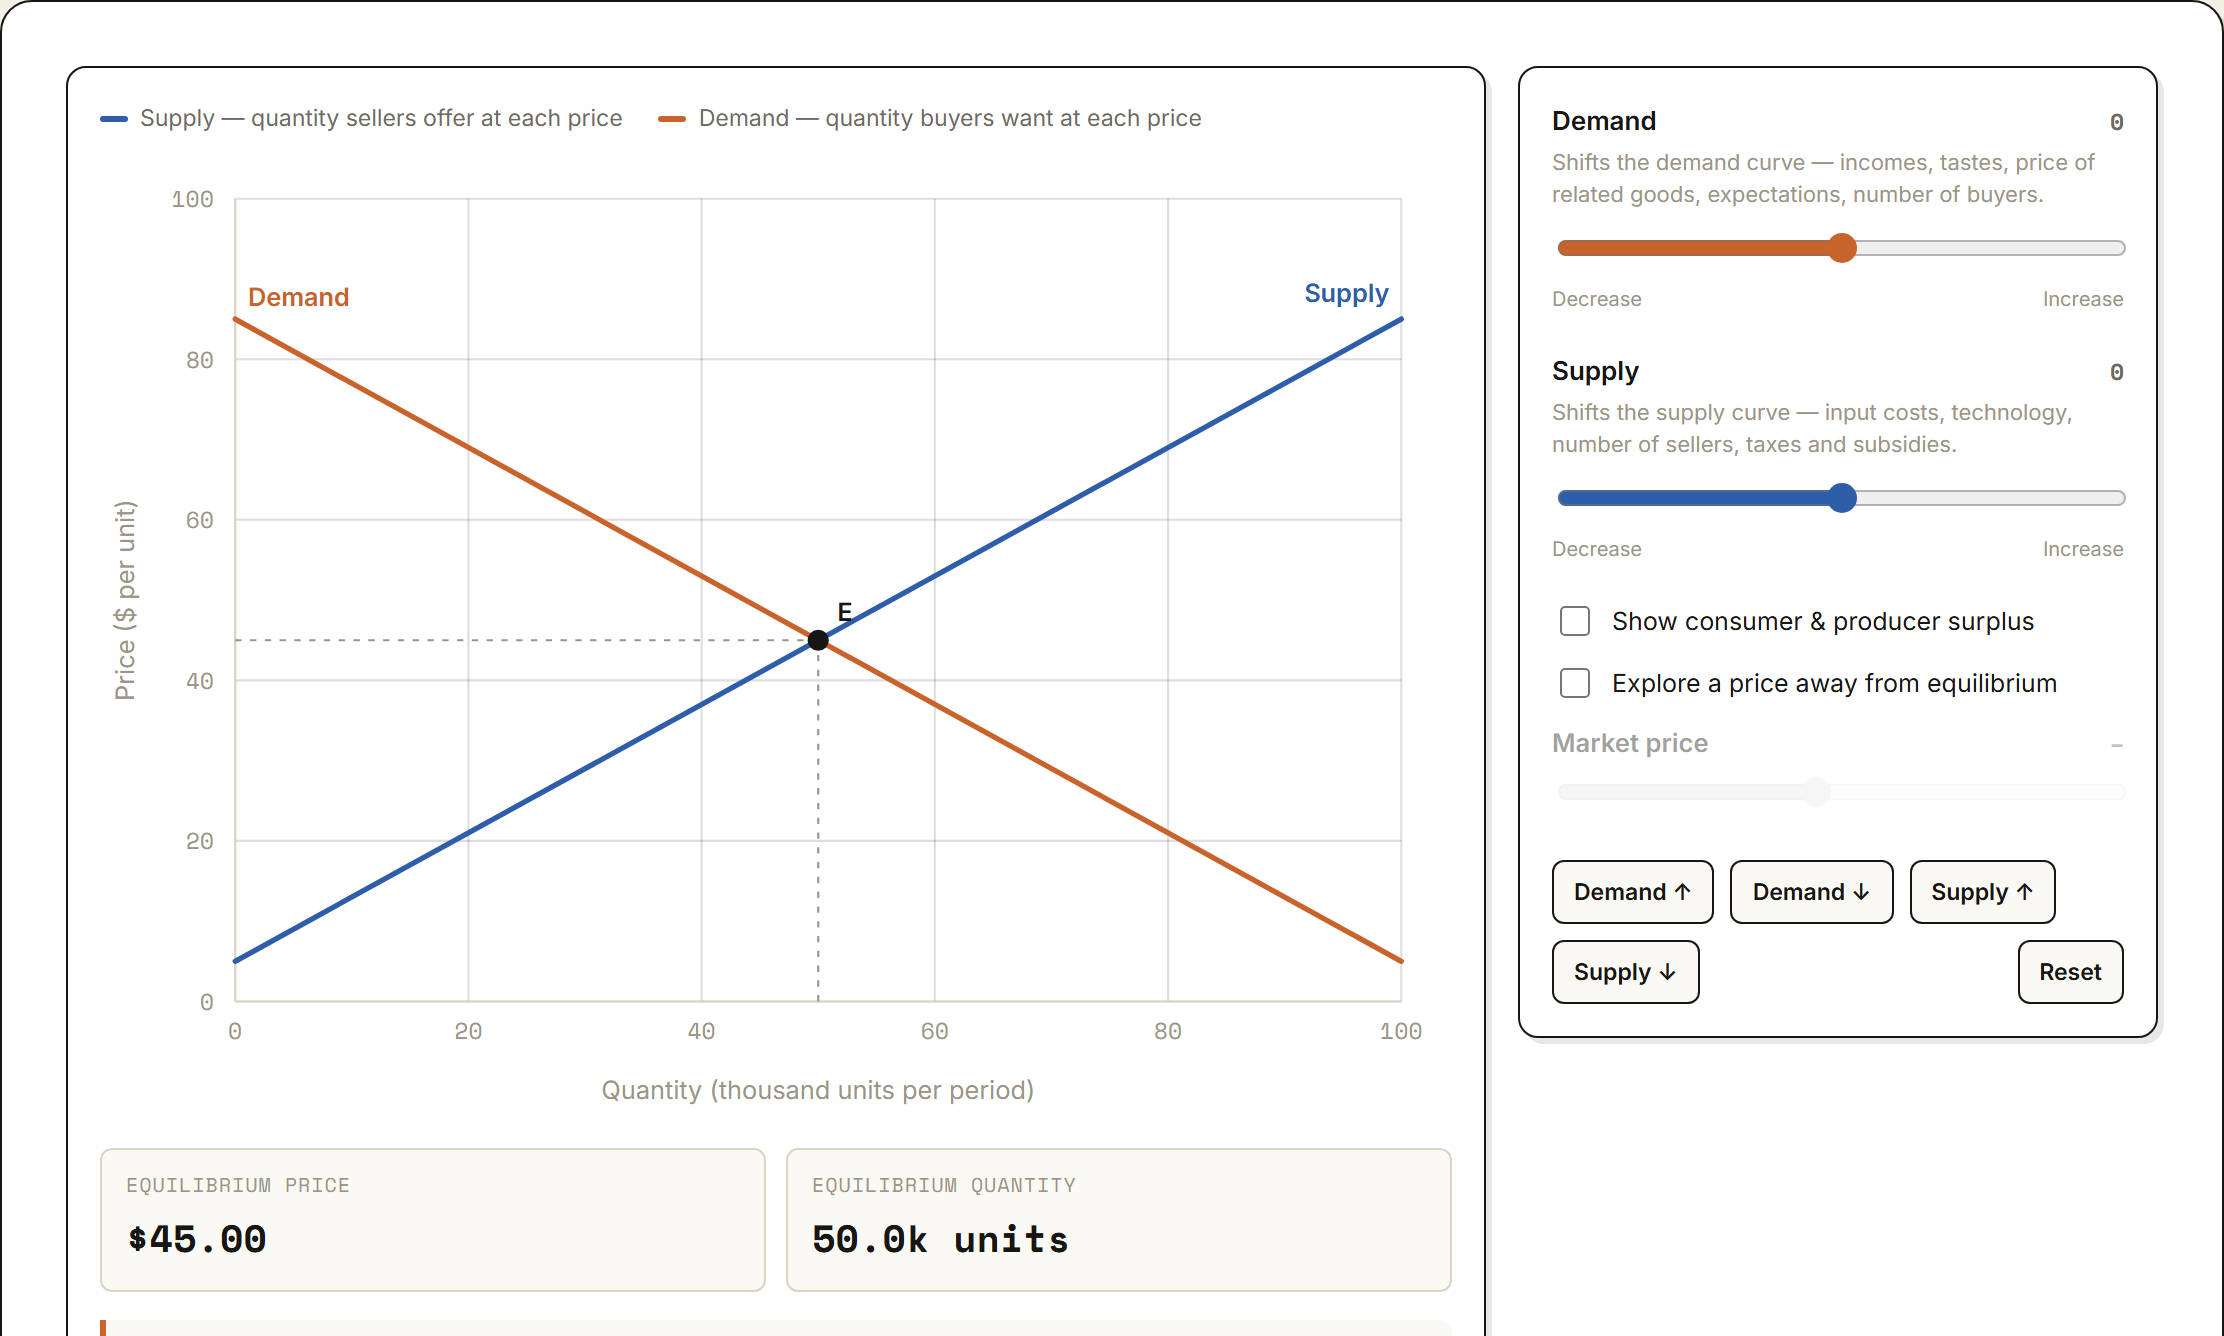
Supply & Demand Equilibrium
A linear-curve model of a single competitive market. Slide the demand and supply shifters and watch the equilibrium — the crossing point where quantity demanded equals quantity supplied — move: a demand increase raises both price and quantity, a supply increase raises quantity but lowers price. Toggle a price explorer to hold the market away from equilibrium and see a shortage (excess demand) or surplus (excess supply) open up, or shade in consumer and producer surplus to see the gains from trade — and how a shortage destroys some of them. A simplified illustrative model, not a calibrated forecast.
Play with it →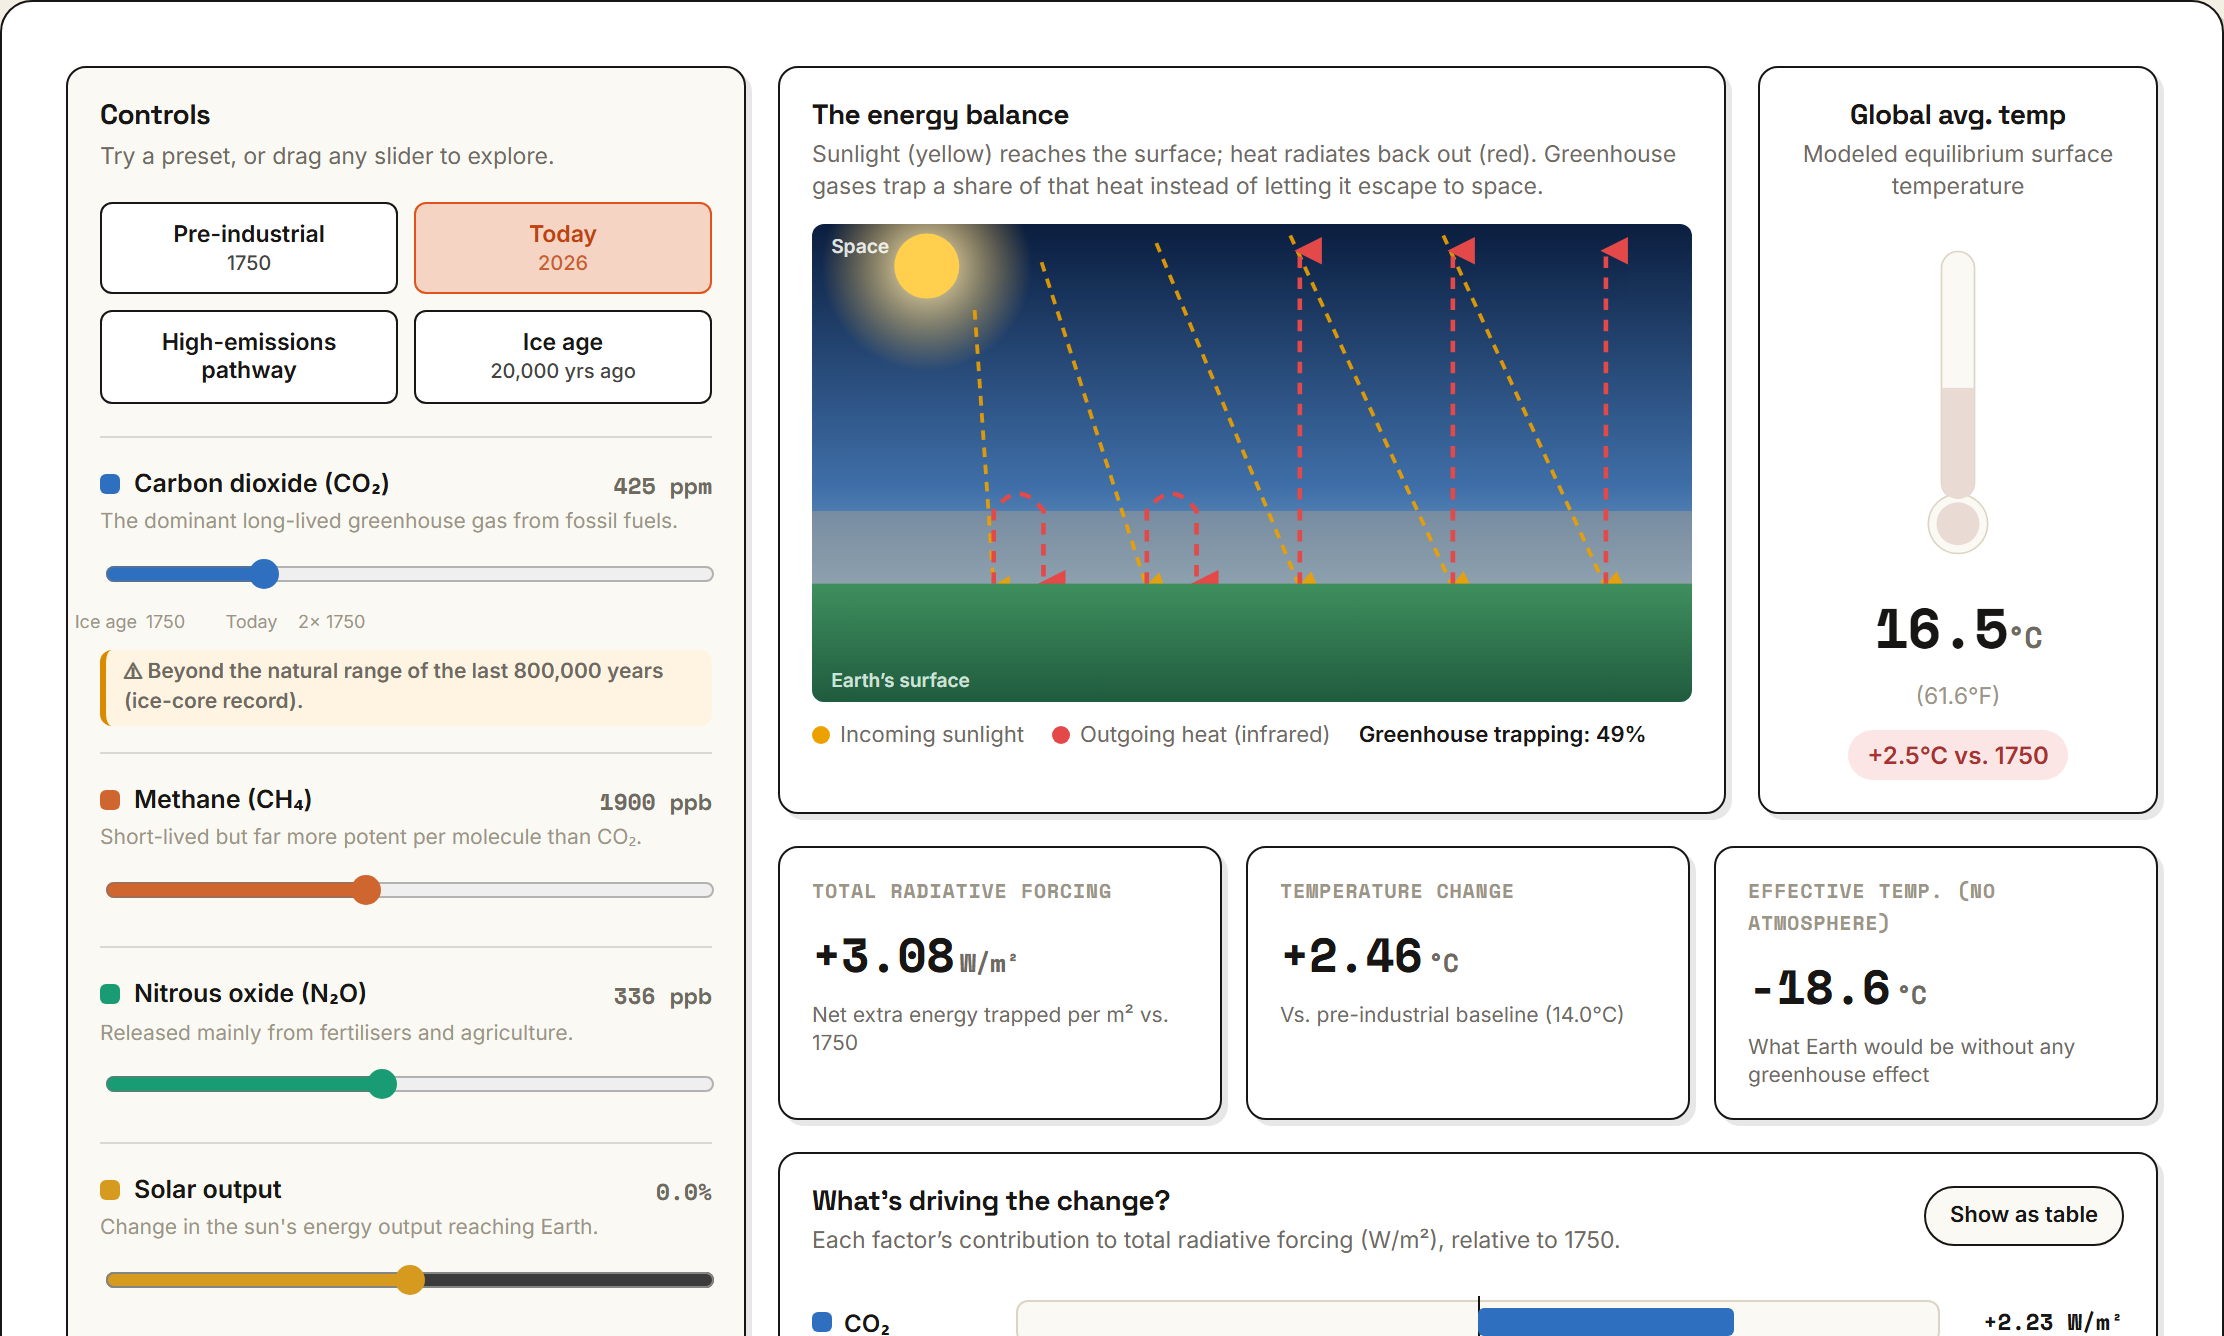
Greenhouse Effect Simulator
A simplified radiative-forcing climate model. Adjust atmospheric CO2, methane and nitrous oxide, the sun's output and Earth's reflectivity, and watch total radiative forcing, the modeled equilibrium surface temperature, and a factor-by-factor breakdown respond. An energy-balance diagram shows how many of five outgoing infrared rays escape to space versus getting trapped and re-radiated down. Presets cover pre-industrial 1750, today, a high-emissions pathway and an ice age. Uses the standard IPCC AR5 simplified forcing formulas with a climate sensitivity of 0.8 degC per W/m2 - an equilibrium estimate for teaching, not a forecast.
Play with it →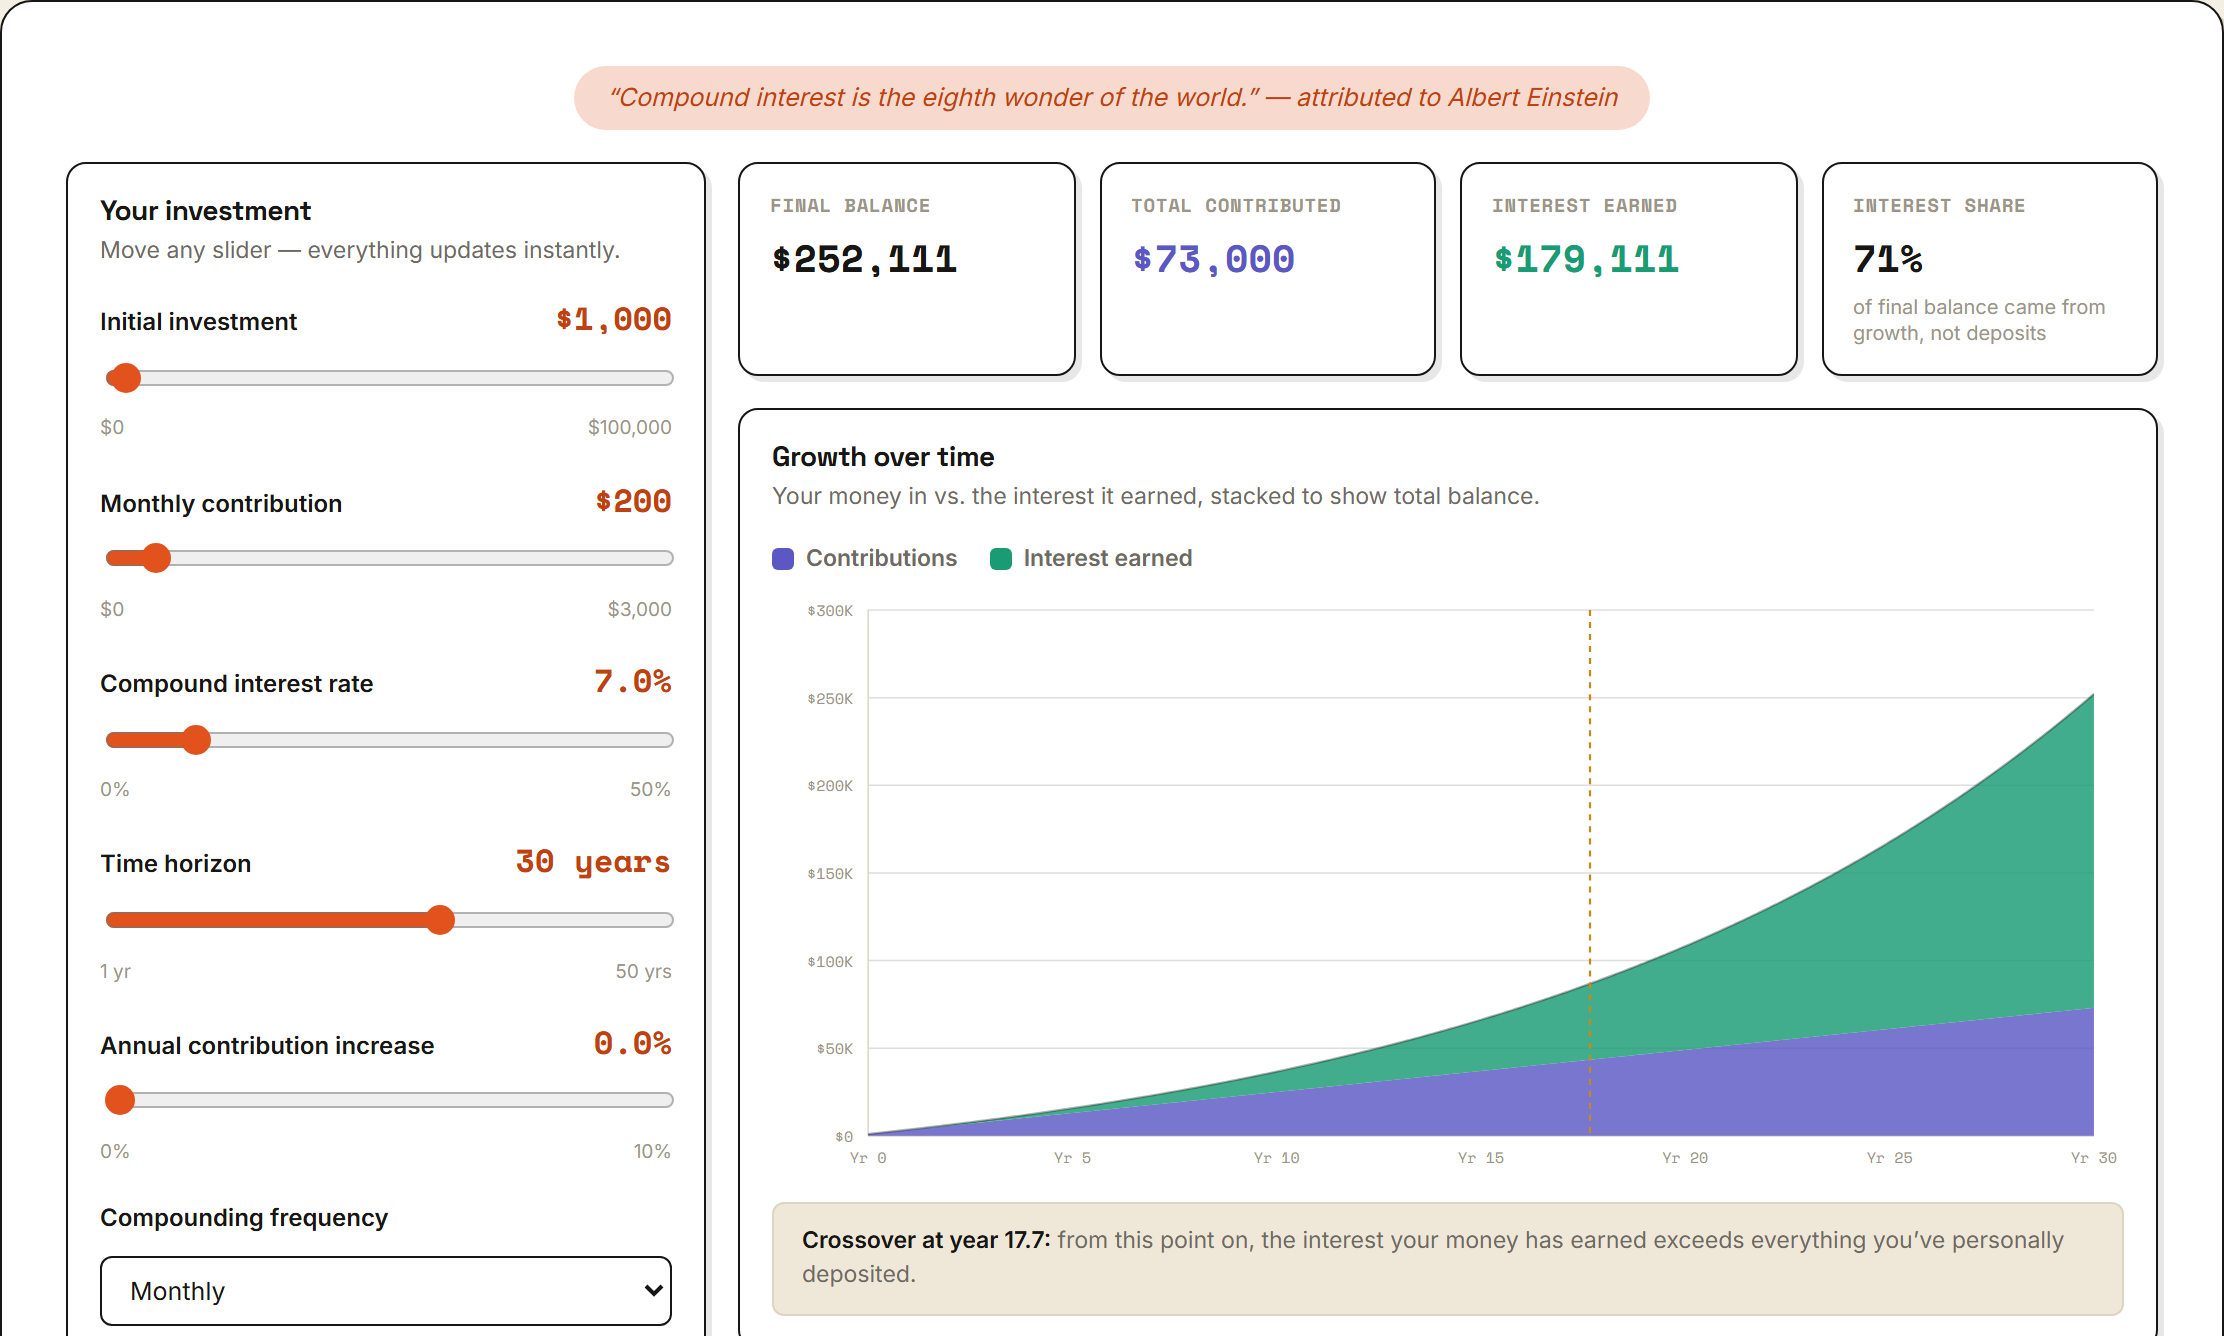
Compound Interest Explorer
A month-by-month savings-growth model. Set an initial amount, a monthly contribution (which can grow each year with your raises), a rate, a horizon, a compounding frequency and whether you deposit at the start or end of each month. A stacked chart splits every balance into the money you paid in versus the interest it earned, and marks the crossover year where growth overtakes deposits. A two-investors panel shows the cost of waiting — how far behind a delayed start leaves you and the monthly top-up it would take to catch up — and an optional panel compares two compounding frequencies. Educational only; assumes a constant annual return, which real markets never provide.
Play with it →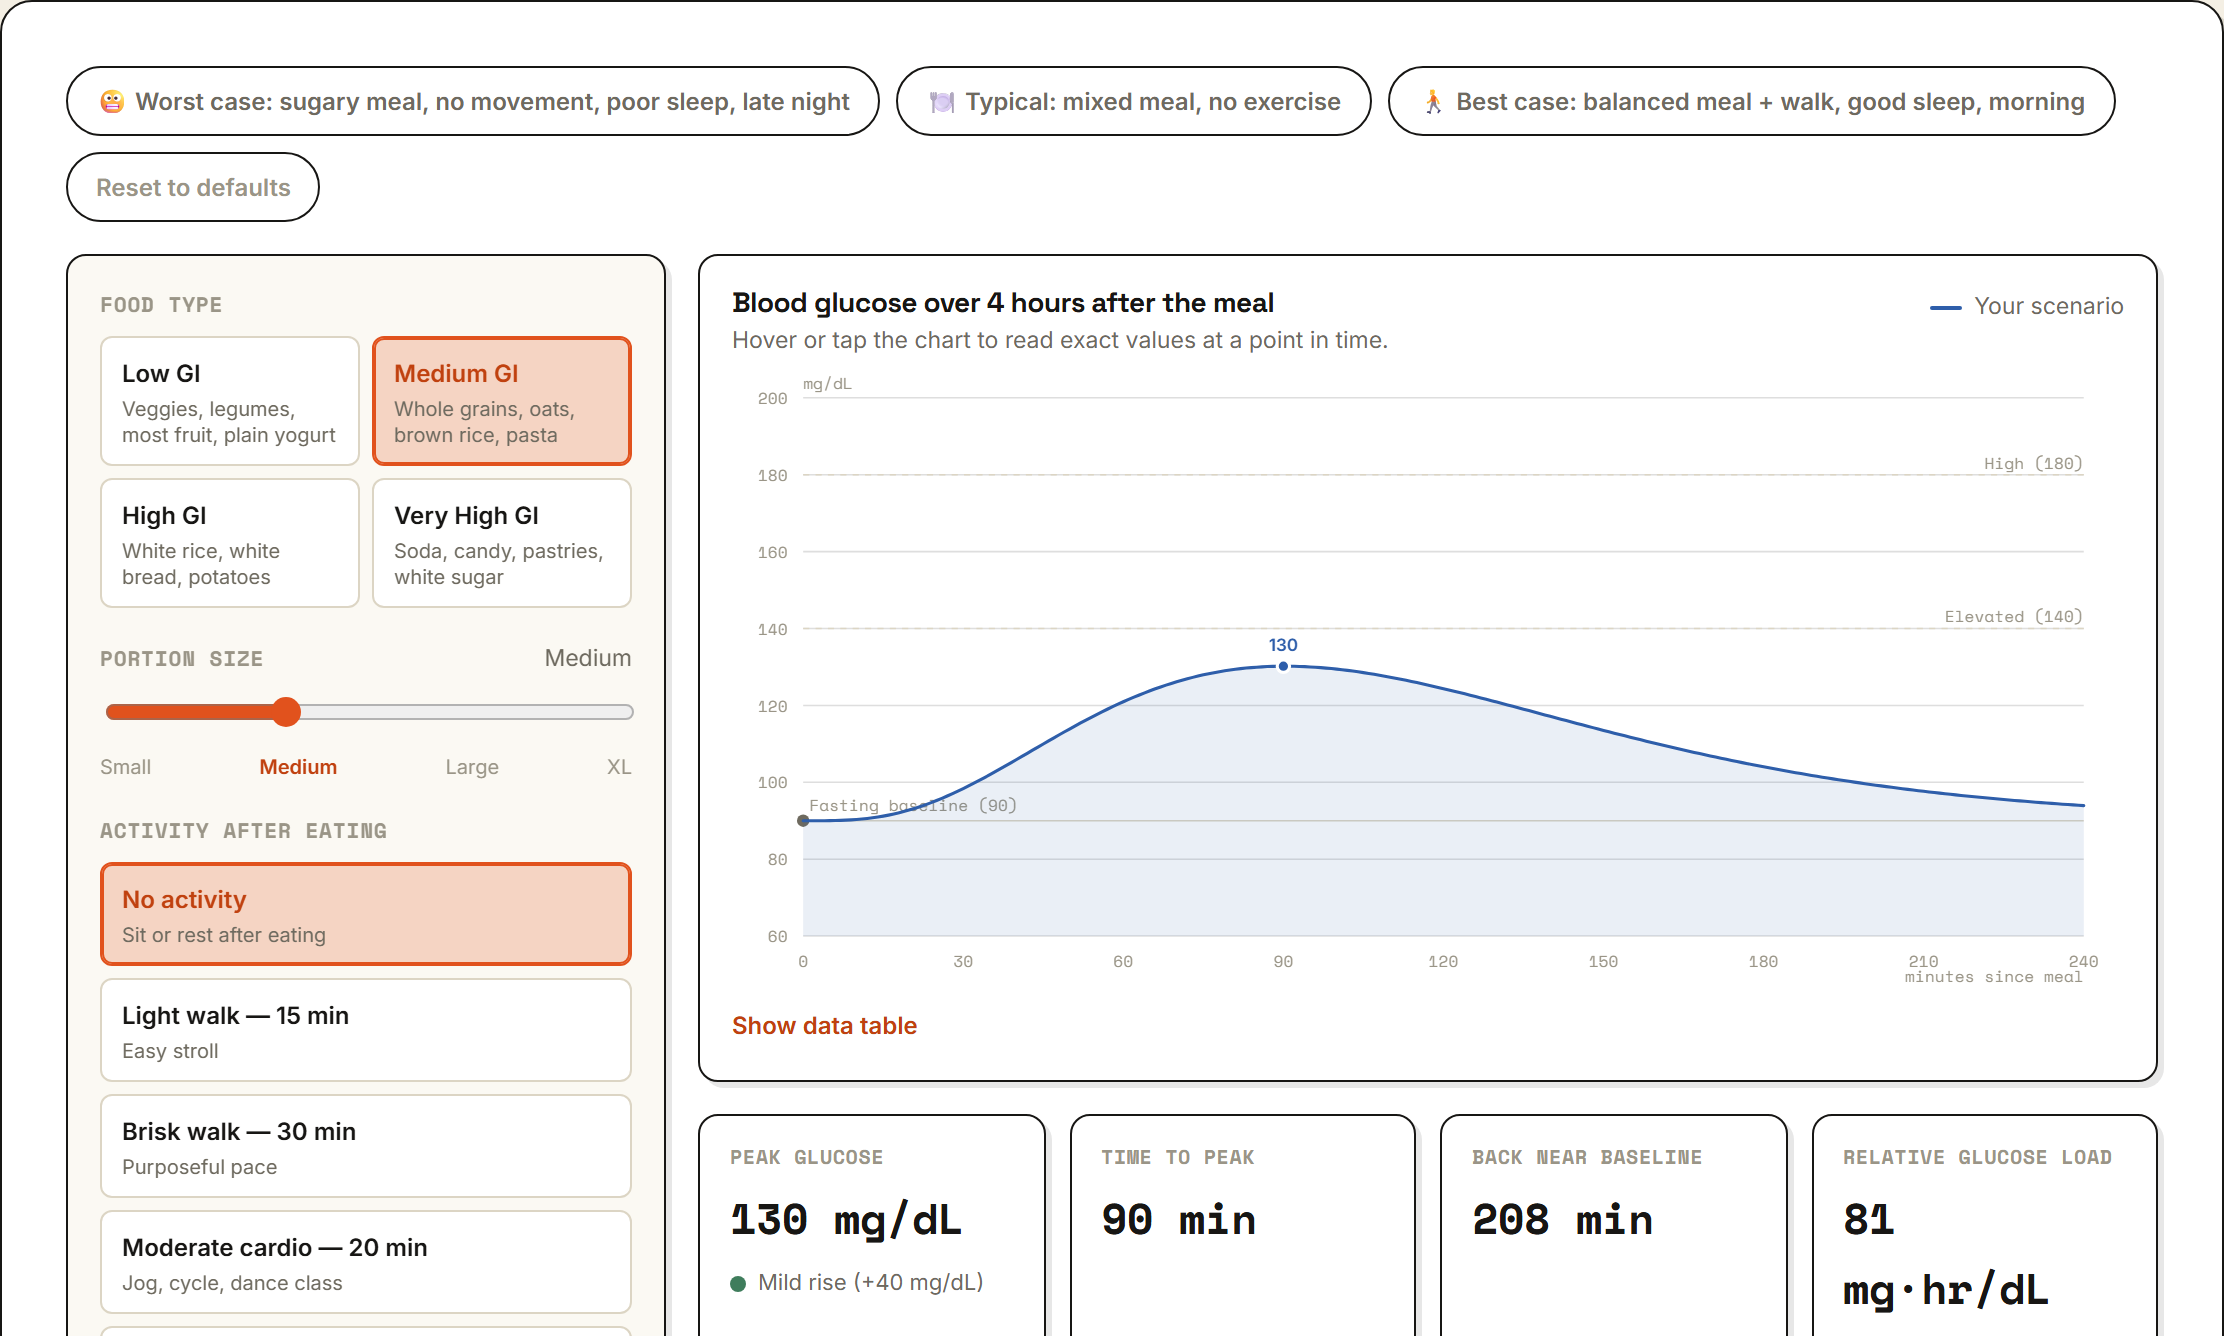
Blood Sugar After a Meal
A simplified, illustrative model of the post-prandial ('after eating') blood-glucose response. An absorption pulse whose shape is set by the food's glycaemic index feeds a first-order clearance term back toward a fasting baseline, and that clearance rate is scaled by sleep quality, meal timing and — while you move plus a fading window afterward — post-meal activity. Pick a food, portion, activity and when you start it, your sleep and the time of day, and read the peak, the time to peak, the time back to baseline and the area under the curve, with an optional overlay of the same meal without exercise. Presets cover a worst case, a typical meal and a best case. A teaching diagram with hand-tuned parameters — not fitted to clinical data, not medical advice.
Play with it →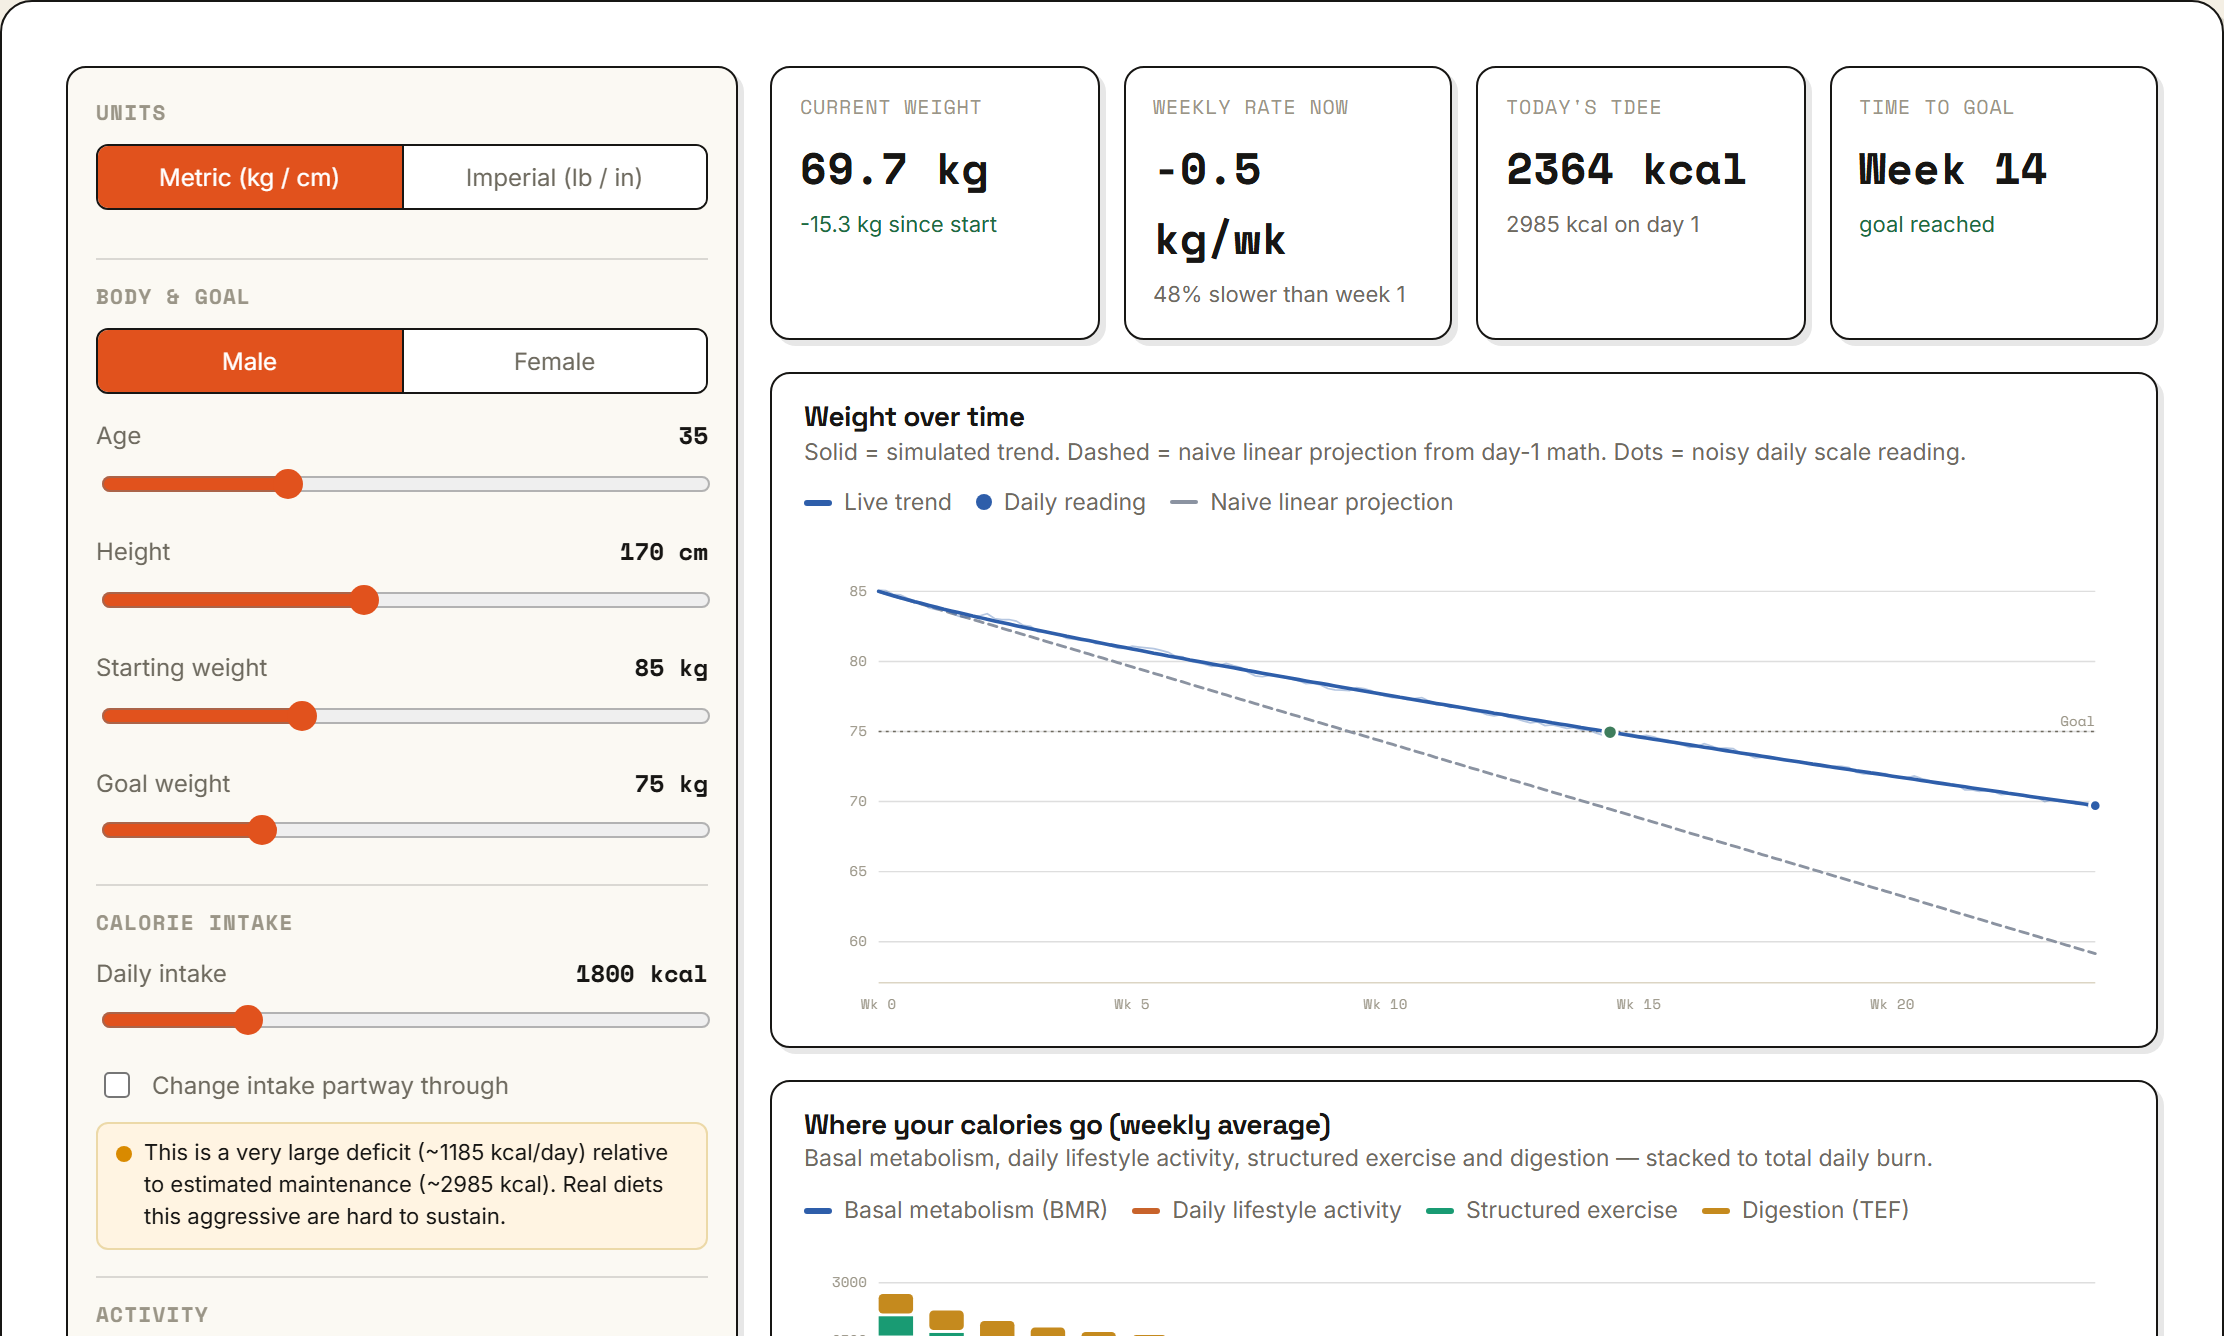
Calories, Activity & Weight Trends
A day-by-day energy-balance simulator. Set body stats, calorie intake and activity, and watch weight respond over weeks or years: each day BMR is recomputed from the current weight, scaled by a metabolic-adaptation factor that ramps toward a 15% ceiling during a sustained deficit, then combined with lifestyle activity, structured exercise and the thermic effect of food into TDEE; the day's calorie balance moves weight by balance divided by 7,700 kcal per kg. A weight chart overlays the simulated trend, a noisy scale reading and the naive linear projection; a stacked chart splits the daily burn into BMR / lifestyle / exercise / digestion; a diverging chart shows the weekly deficit or surplus. Snapshot up to two scenarios to compare, and switch intake partway through to model a diet break. Educational only, not medical advice.
Play with it →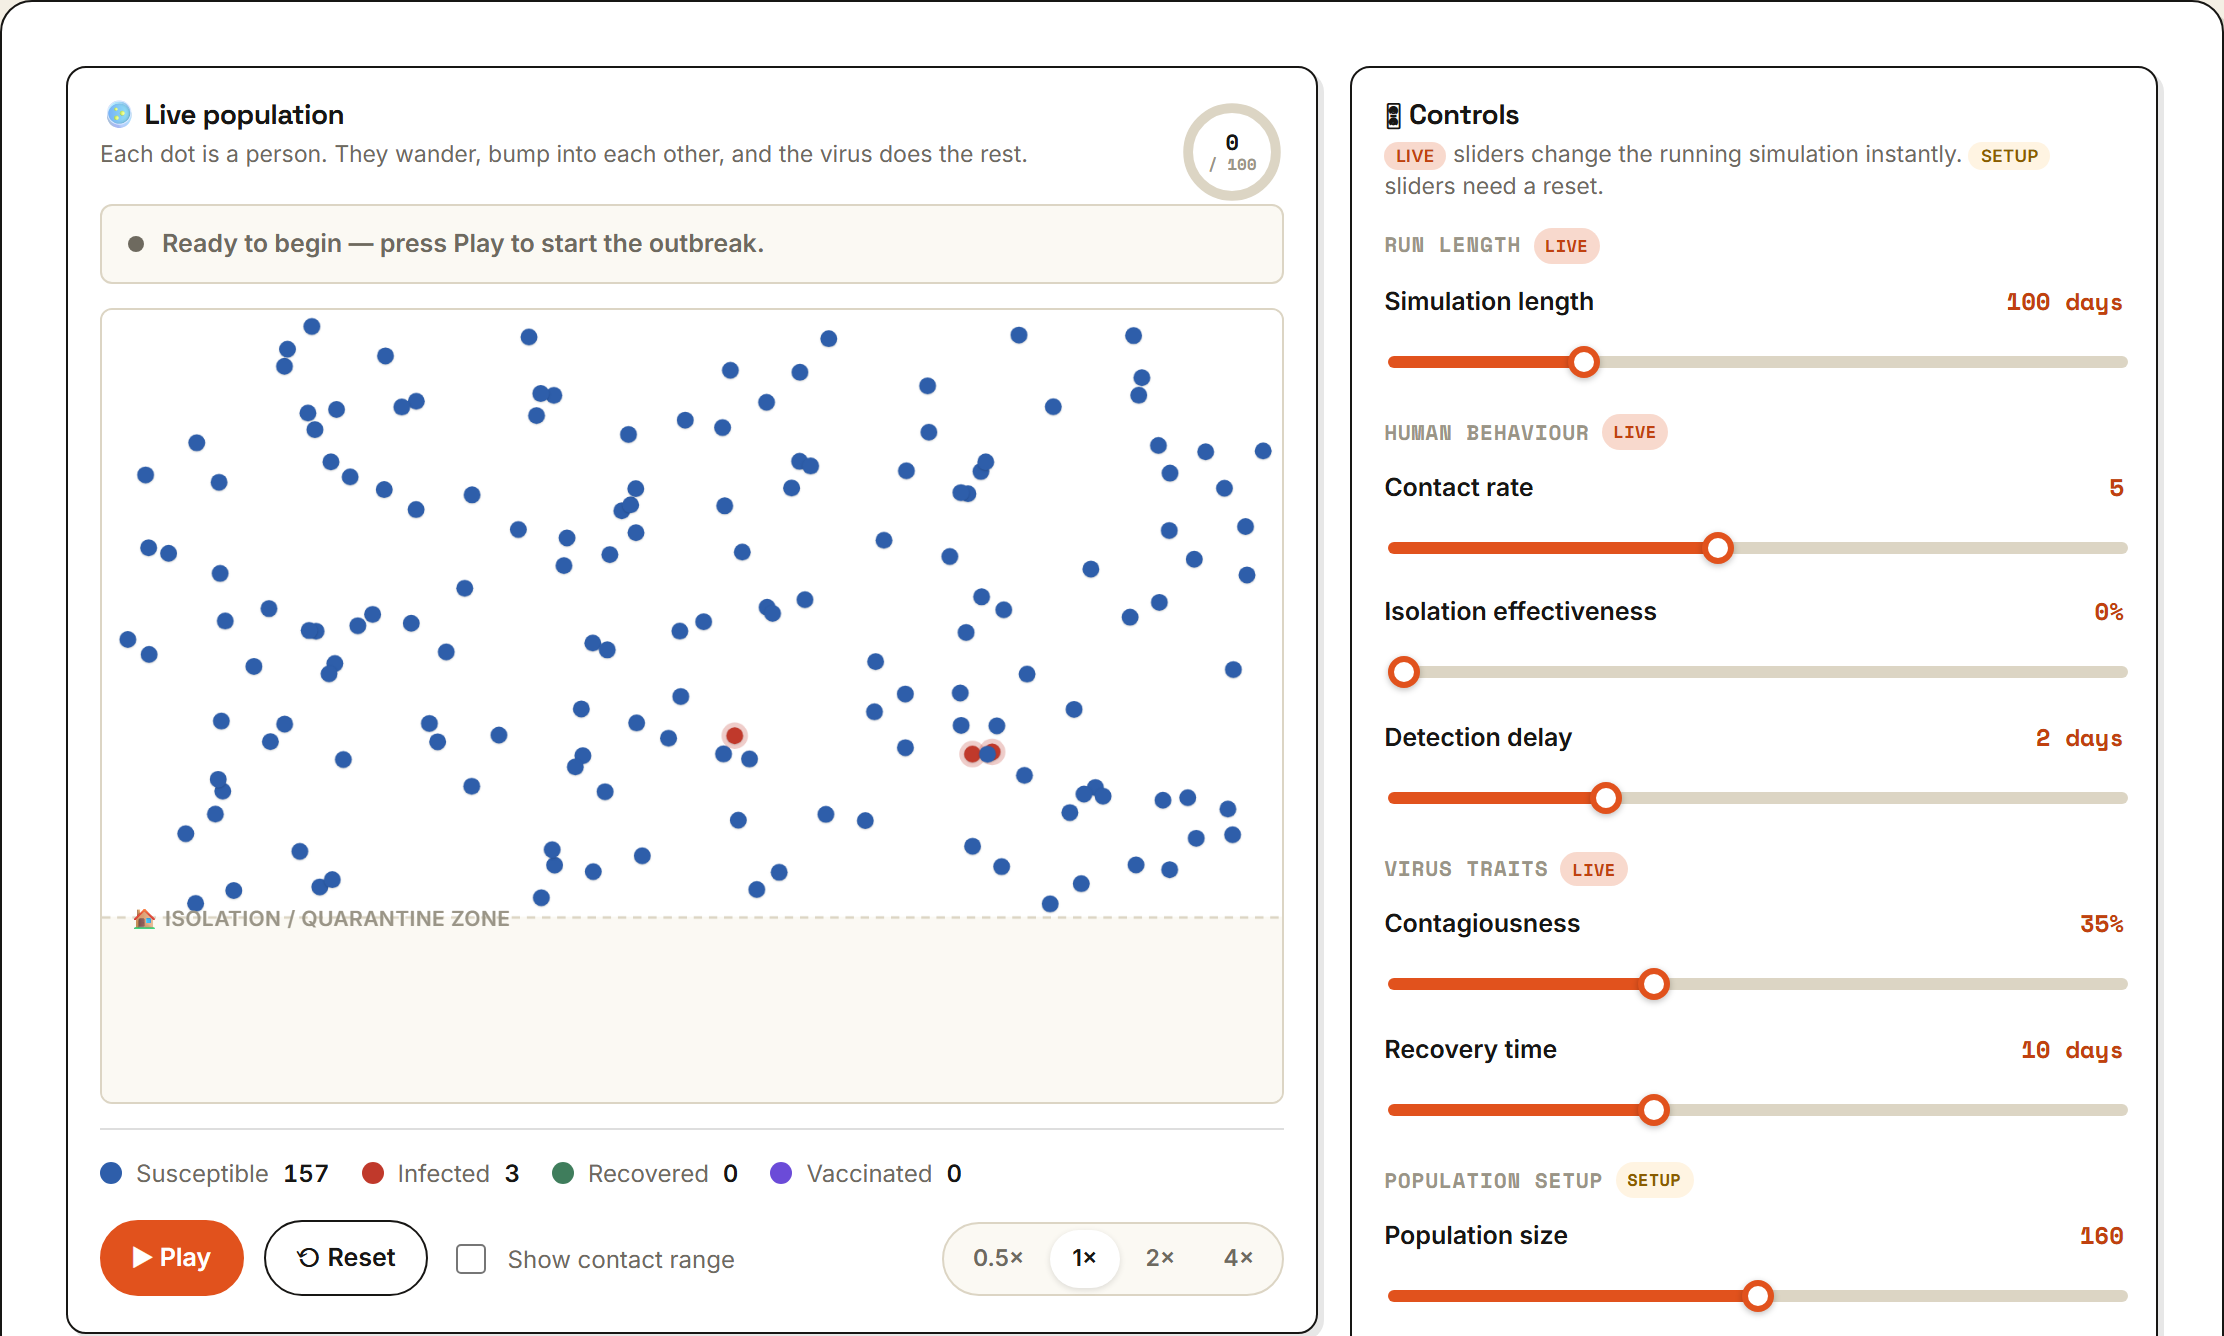
How Infection Spreads
An agent-based outbreak playground, a variant of the classic SIR model. Dozens of dots wander a shared space; an infectious dot near a susceptible one transmits with a probability set by contagiousness, and contact rate controls how often those encounters happen. After a detection delay, sick dots may be isolated into a quarantine pen; prior immunity and vaccination start a share of the population already protected; an optional mortality rate makes the illness fatal. Live sliders change the running outbreak instantly, setup sliders restart it, and a stacked epidemic curve tracks the whole population over time alongside R0, effective R and the herd-immunity threshold. One-click presets cover no precautions, social distancing, isolating the sick, a vaccination drive and a full response. A simplified illustrative model, not an epidemiological forecast.
Play with it →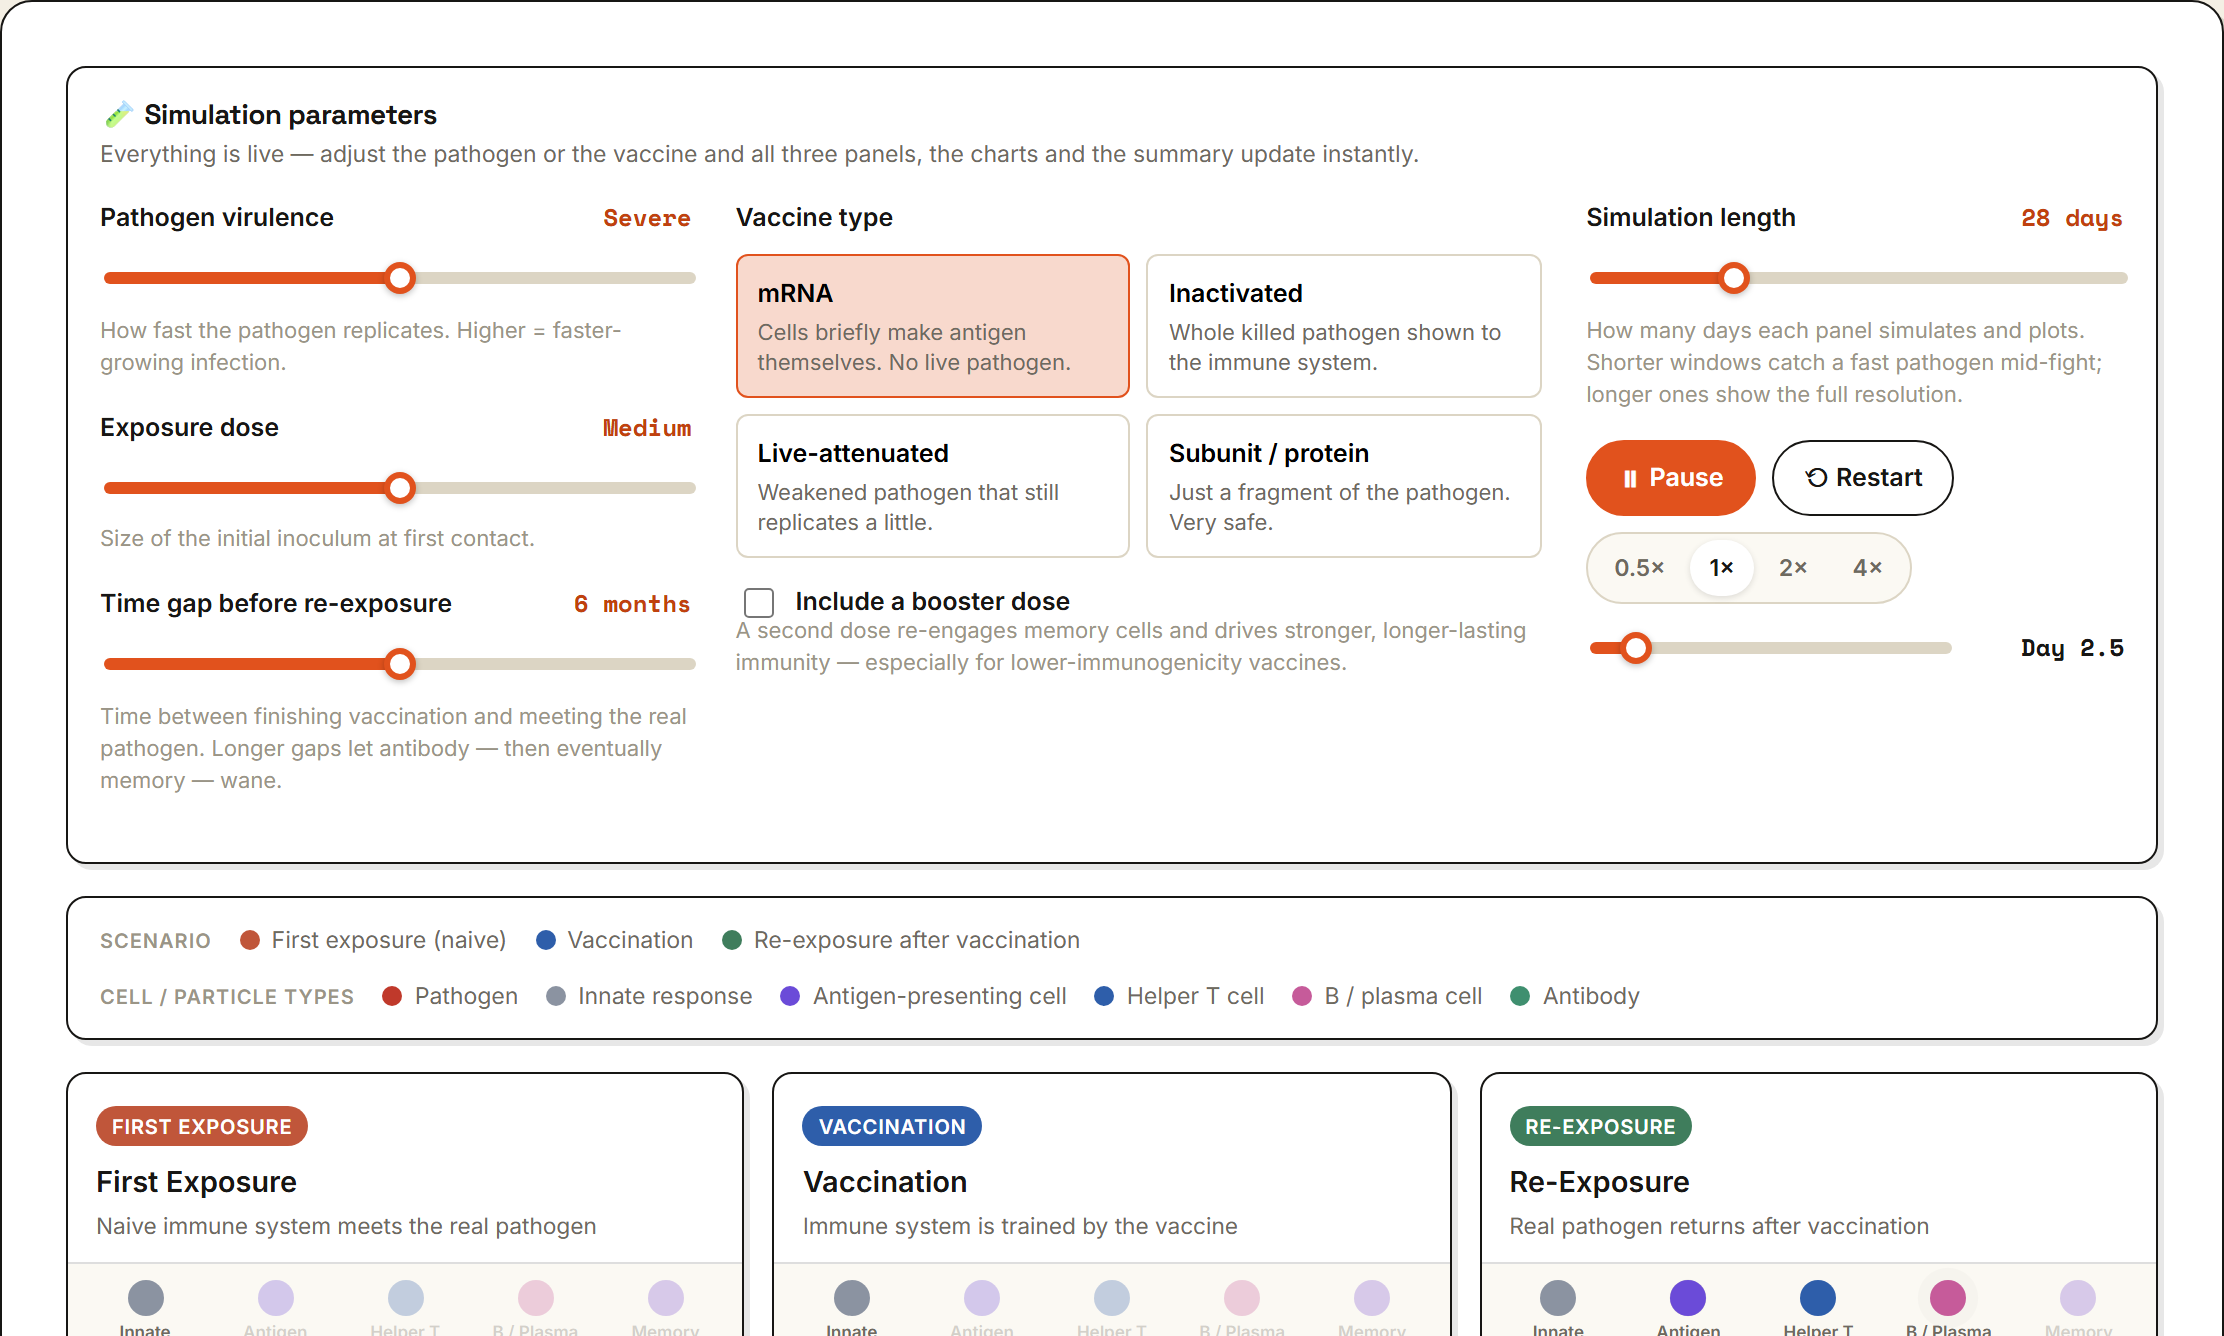
How the Immune System Trains
An interactive model of how vaccines build immunity. One simplified ODE engine runs three side-by-side scenarios against the same pathogen: an unprepared naive first infection, a vaccination that teaches the immune system safely, and a later real exposure that starts with the memory and antibody left over from that vaccination, decayed across a chosen time gap. Live controls set pathogen virulence, exposure dose, vaccine type (mRNA, inactivated, live-attenuated or subunit), an optional booster, the re-exposure gap and the simulation length. Each panel shows an activating cell cascade, a particle battlefield, live readouts and an event timeline; three overlaid charts track pathogen load, antibody titer and memory-cell strength, and a summary table compares days-to-clearance, peak titer, illness burden and final memory strength. Six guided experiments surface one concept each — the power of memory, why boosters matter, waning immunity, and more. An educational illustration of primary vs. secondary immune responses, not clinical data or a specific product.
Play with it →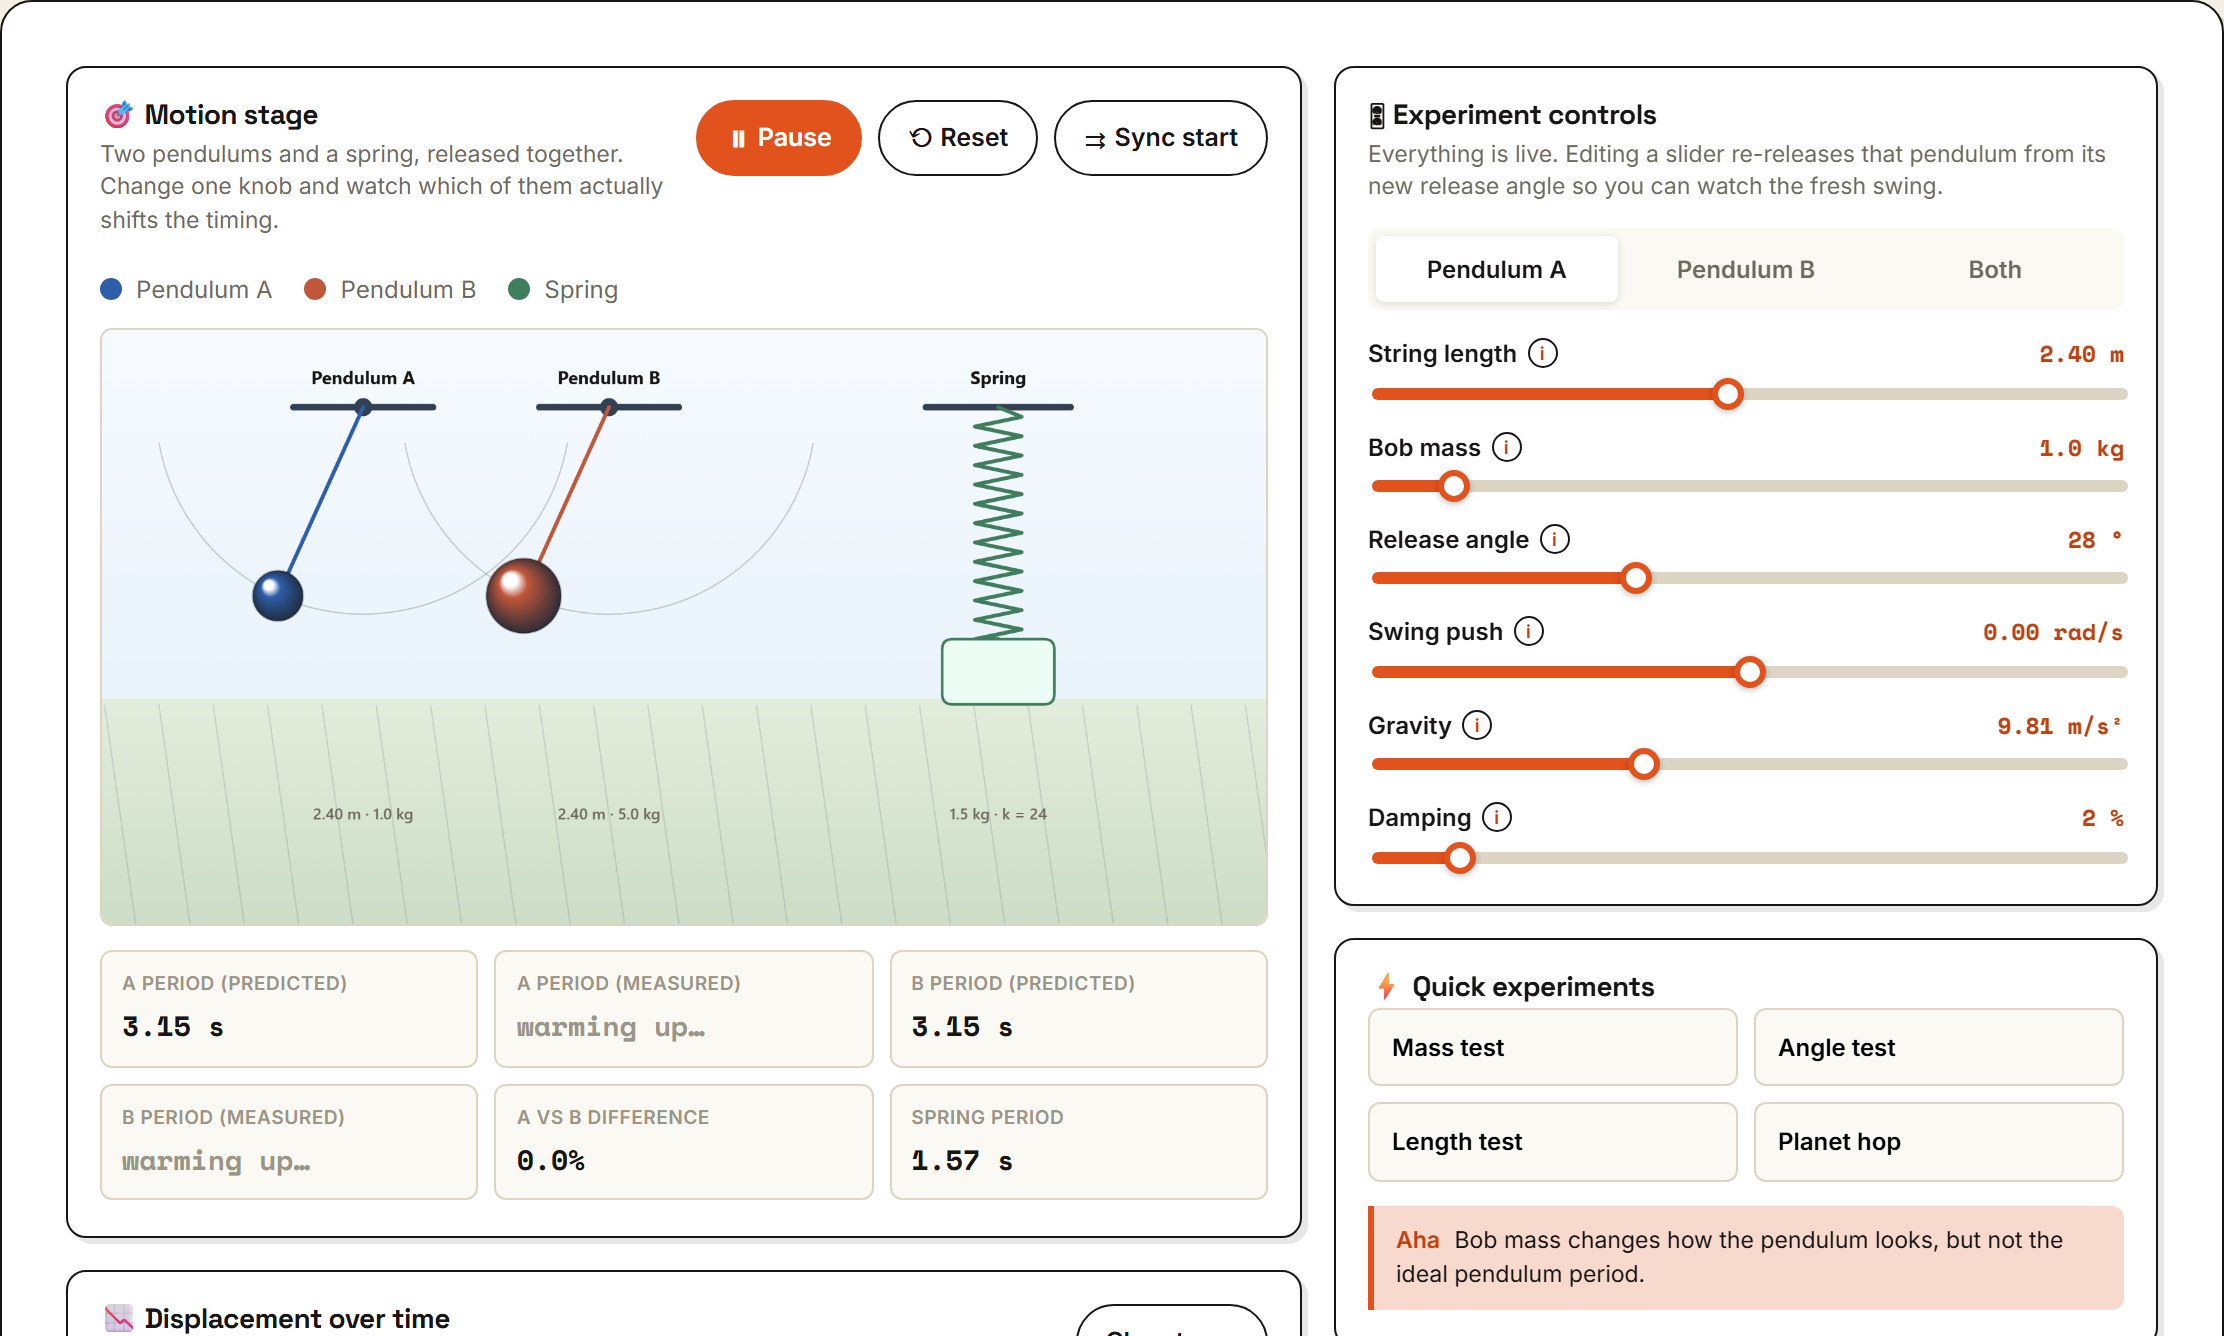
How a Pendulum Works
A live simple-harmonic-motion lab. Two independent pendulums and one spring oscillator share a stage; a scrolling displacement-time trace overlays all three so you can watch them drift apart or stay locked. Each pendulum has its own string length, bob mass, release angle, starting push, gravity and damping, and integrates the full non-linear equation of motion with RK4 — so a wide release genuinely runs slower than the small-angle formula and its trace is not a perfect sine. The spring follows T = 2π√(m/k), the deliberate contrast: for a pendulum mass does nothing, for a spring it sets the tempo. Readouts show each pendulum's predicted vs. live-measured period, their percentage gap and the spring period. One-click presets (mass, angle, length, planet hop), a gravity dropdown for Moon/Mars/Earth/Jupiter, copy-between-pendulums buttons and ten guided experiments round it out. An educational model, not a metrology-grade simulator.
Play with it →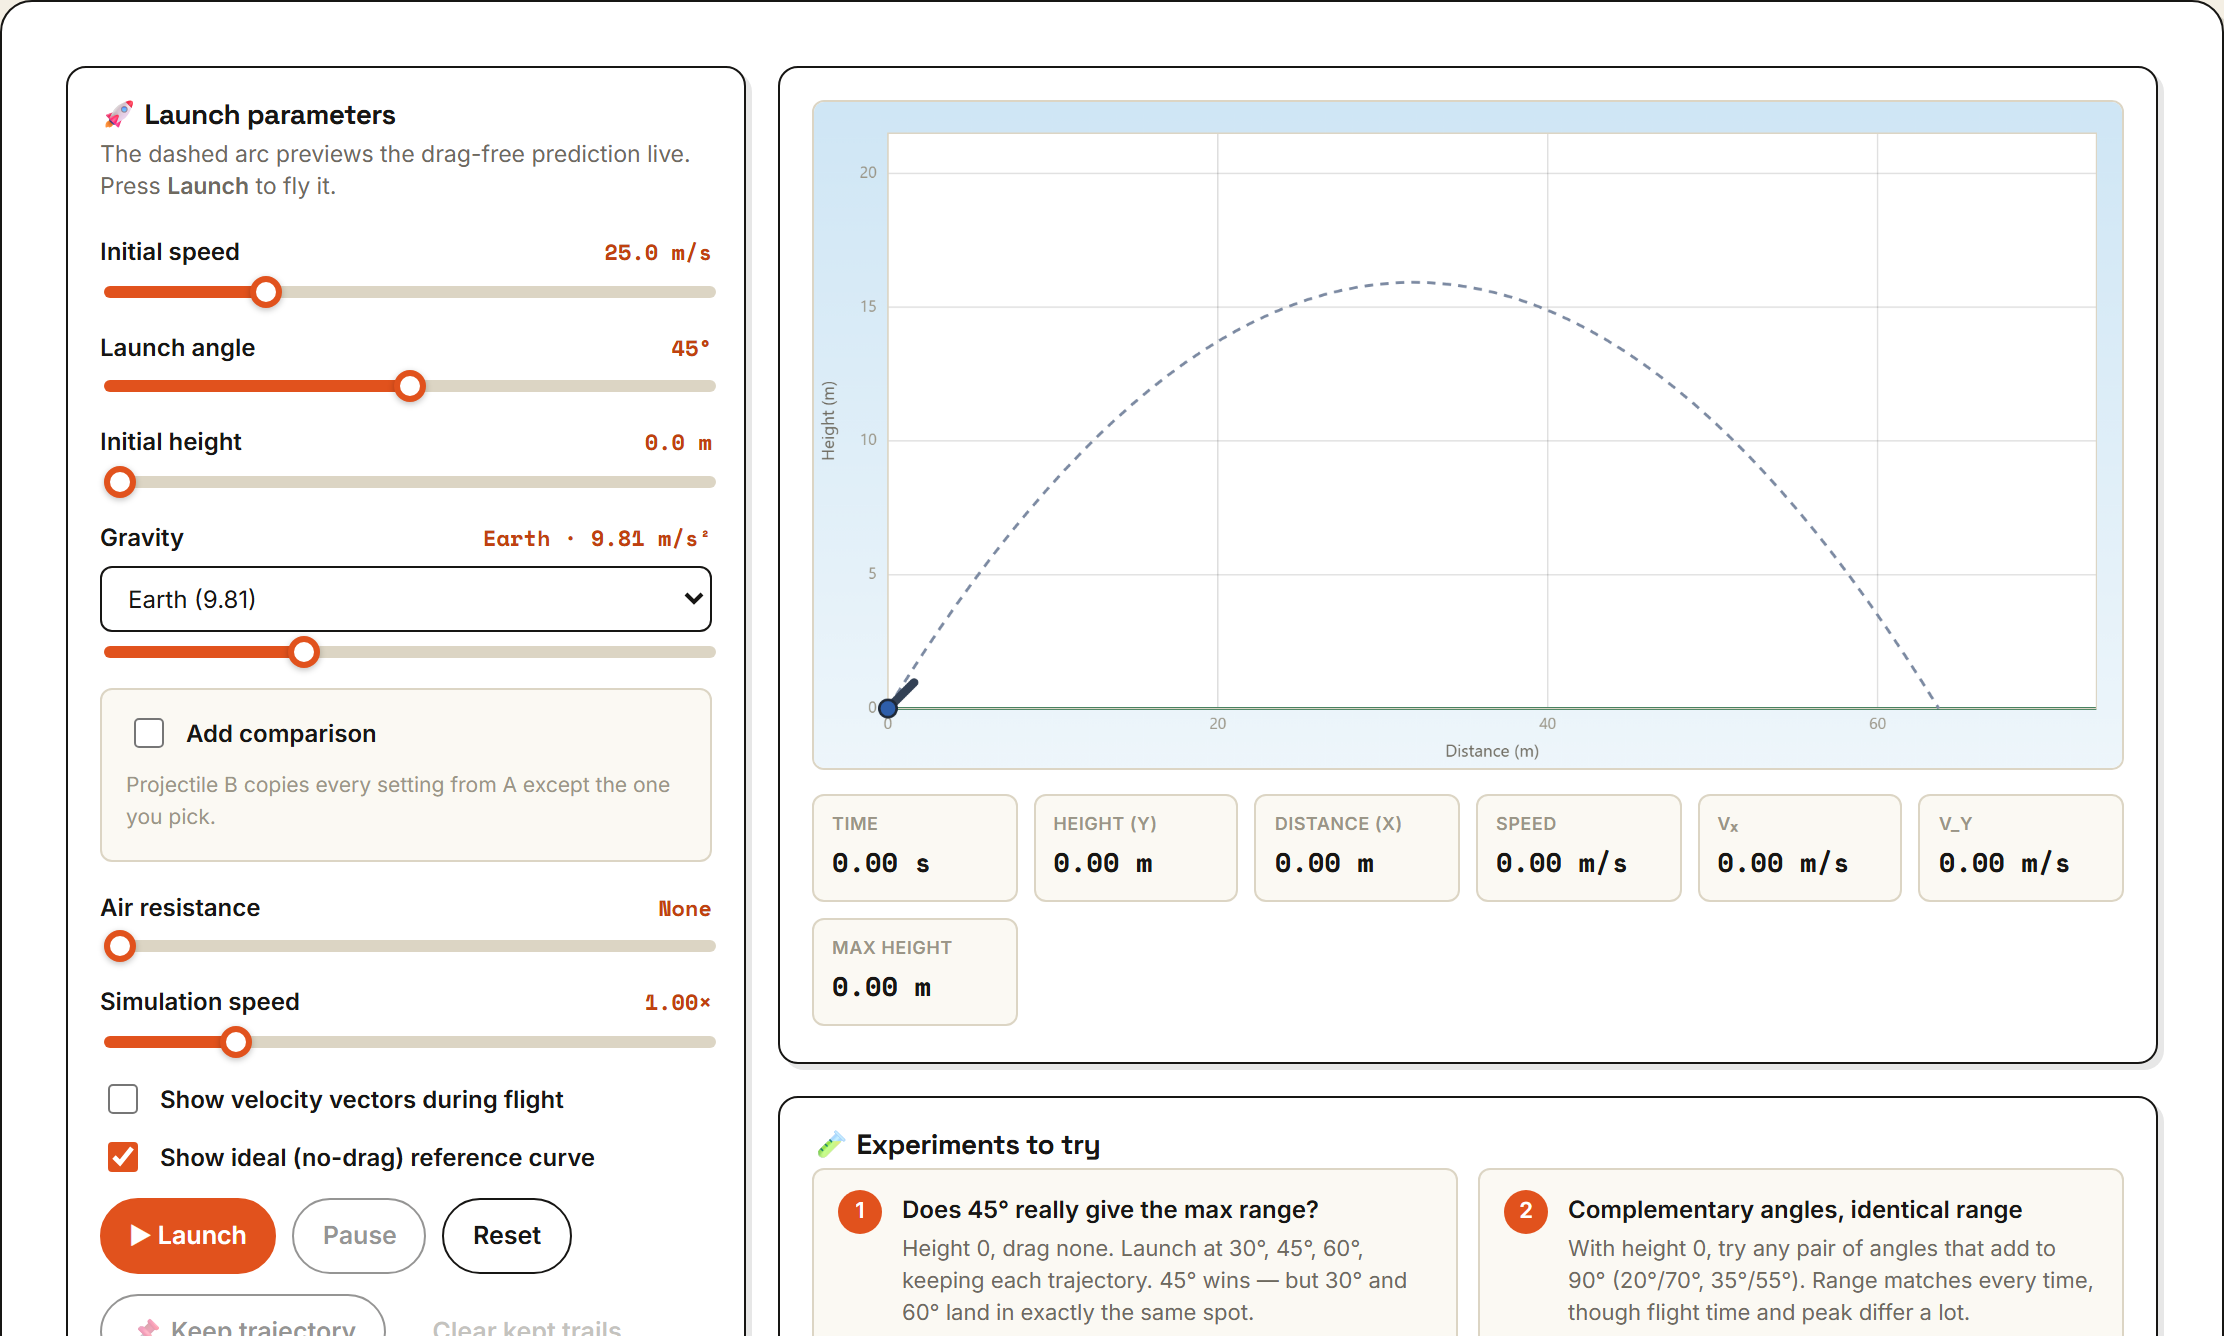
How Projectile Motion Works
A launch-and-watch kinematics lab. Velocity splits into independent horizontal and vertical components: with no drag the horizontal speed stays constant while gravity alone bends the vertical, tracing a parabola. Turn on air resistance and a quadratic drag force −b·|v|·v curves the real path below and short of the dashed ideal curve, with the gap widening as speed². A live preview redraws the predicted arc, launcher angle and axis scale as you drag the controls; Launch runs the flight with adjustable playback speed, optional velocity-vector arrows (vₓ, v_y and resultant) and live readouts for time, position, speed, components and peak height. An optional Projectile B shares every setting with A except one isolated variable — speed, angle, height or gravity (Earth, Moon, Mars, Jupiter or custom) — for a clean controlled comparison, and trajectories can be pinned to compare several launches at once. Ten guided experiments cover the 45° range myth, complementary angles, why height shifts the best angle, v² scaling, and how drag reshapes the arc. An educational model, not a ballistics calculator.
Play with it →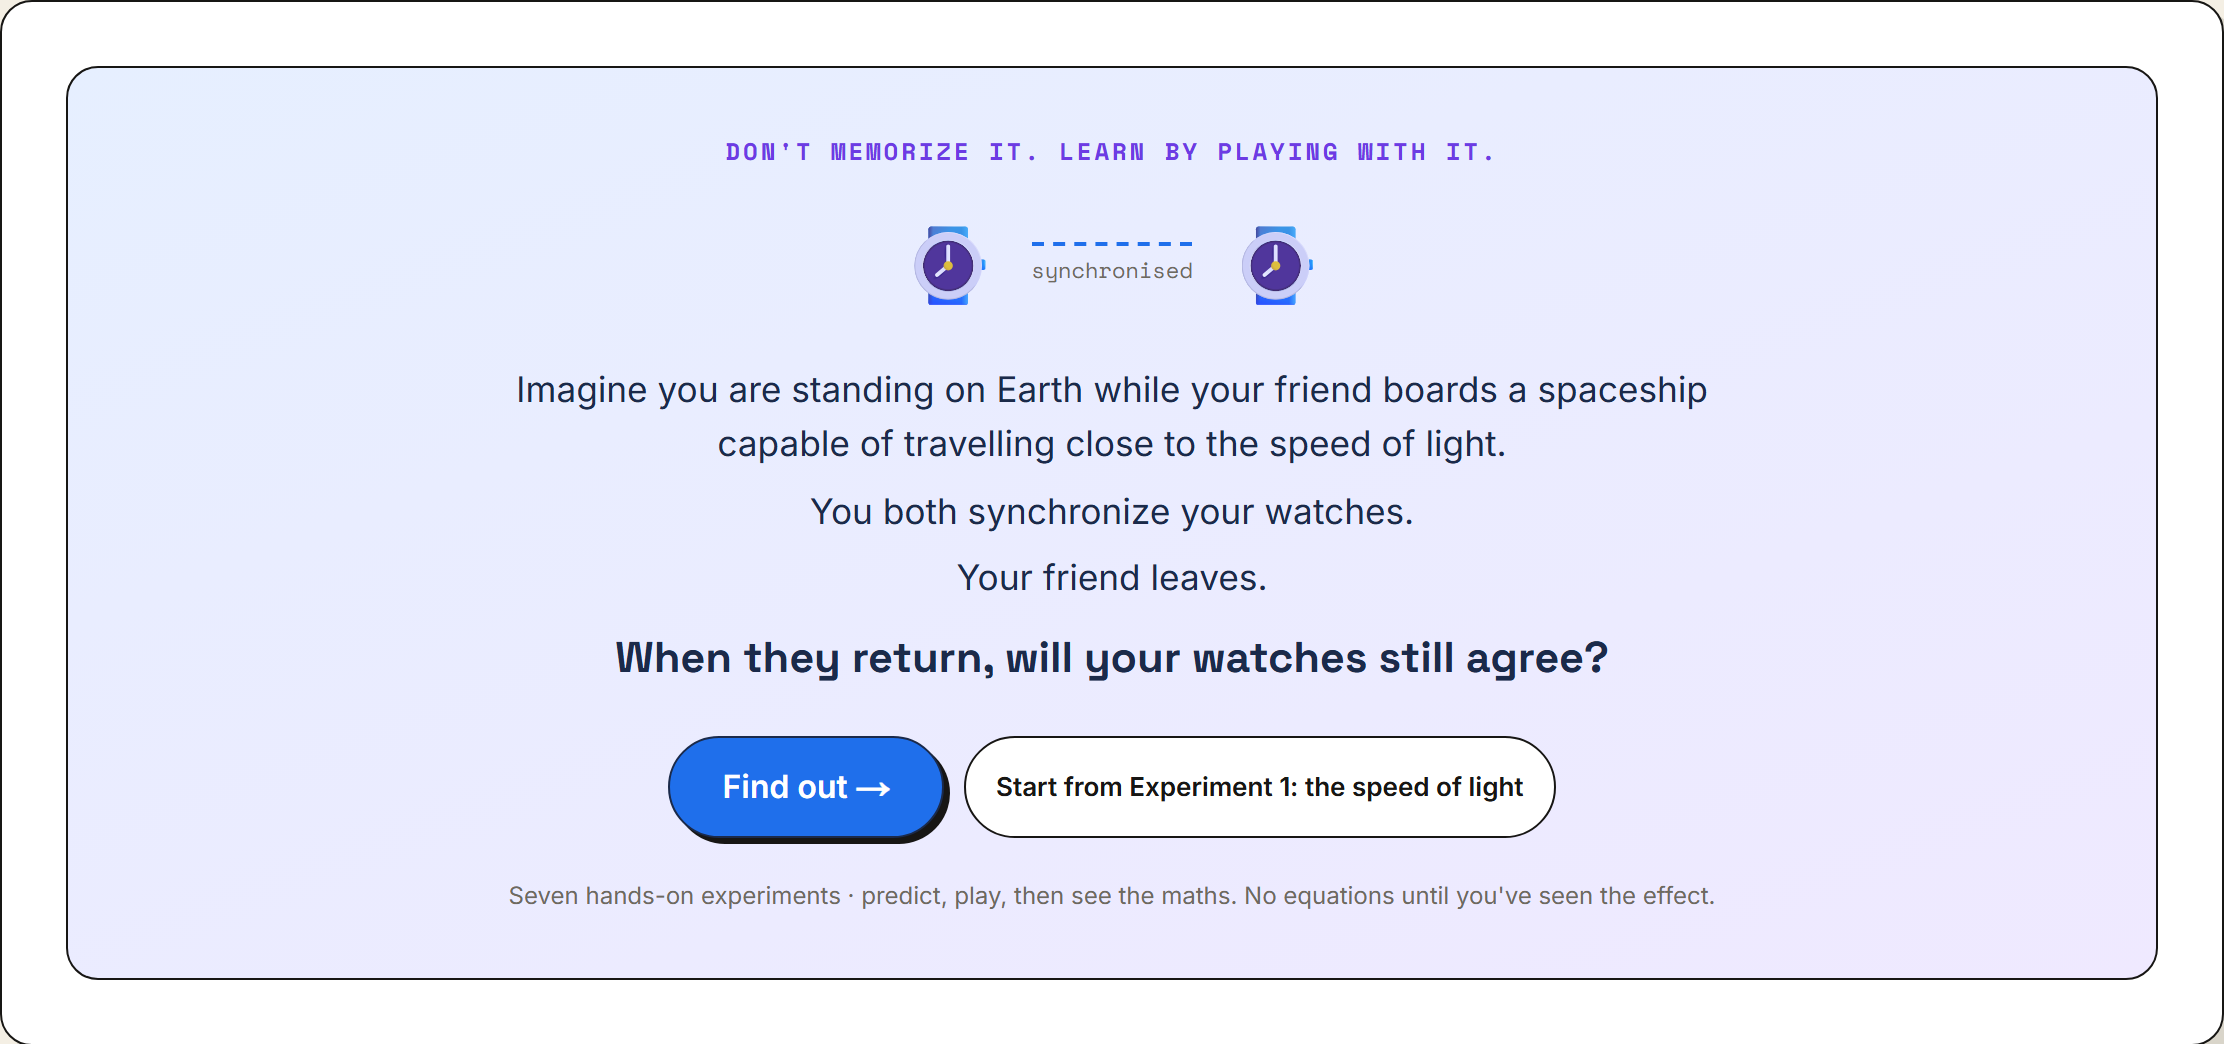
Relativity Playground
Seven hands-on experiments that let you discover Einstein's relativity before you see a single equation. Chase a light beam and find you can never gain on it; race two clocks and watch the moving one fall behind (then see why, with a bouncing-photon light clock); shrink a spaceship by speeding it up and flip reference frames to see who measures what; replay Einstein's lightning-and-train experiment to lose the idea of a universal 'now'; send a twin to a distant star and reunite them years apart; park clocks near Earth, a neutron star and a black hole to see gravity slow time; and connect it all on an interactive spacetime diagram. Predict-before-reveal questions, challenges, a relativity-effect meter, a GPS real-world link and a Simple / Advanced mode that unlocks equations, worldlines and Lorentz-transformed coordinates.
Play with it →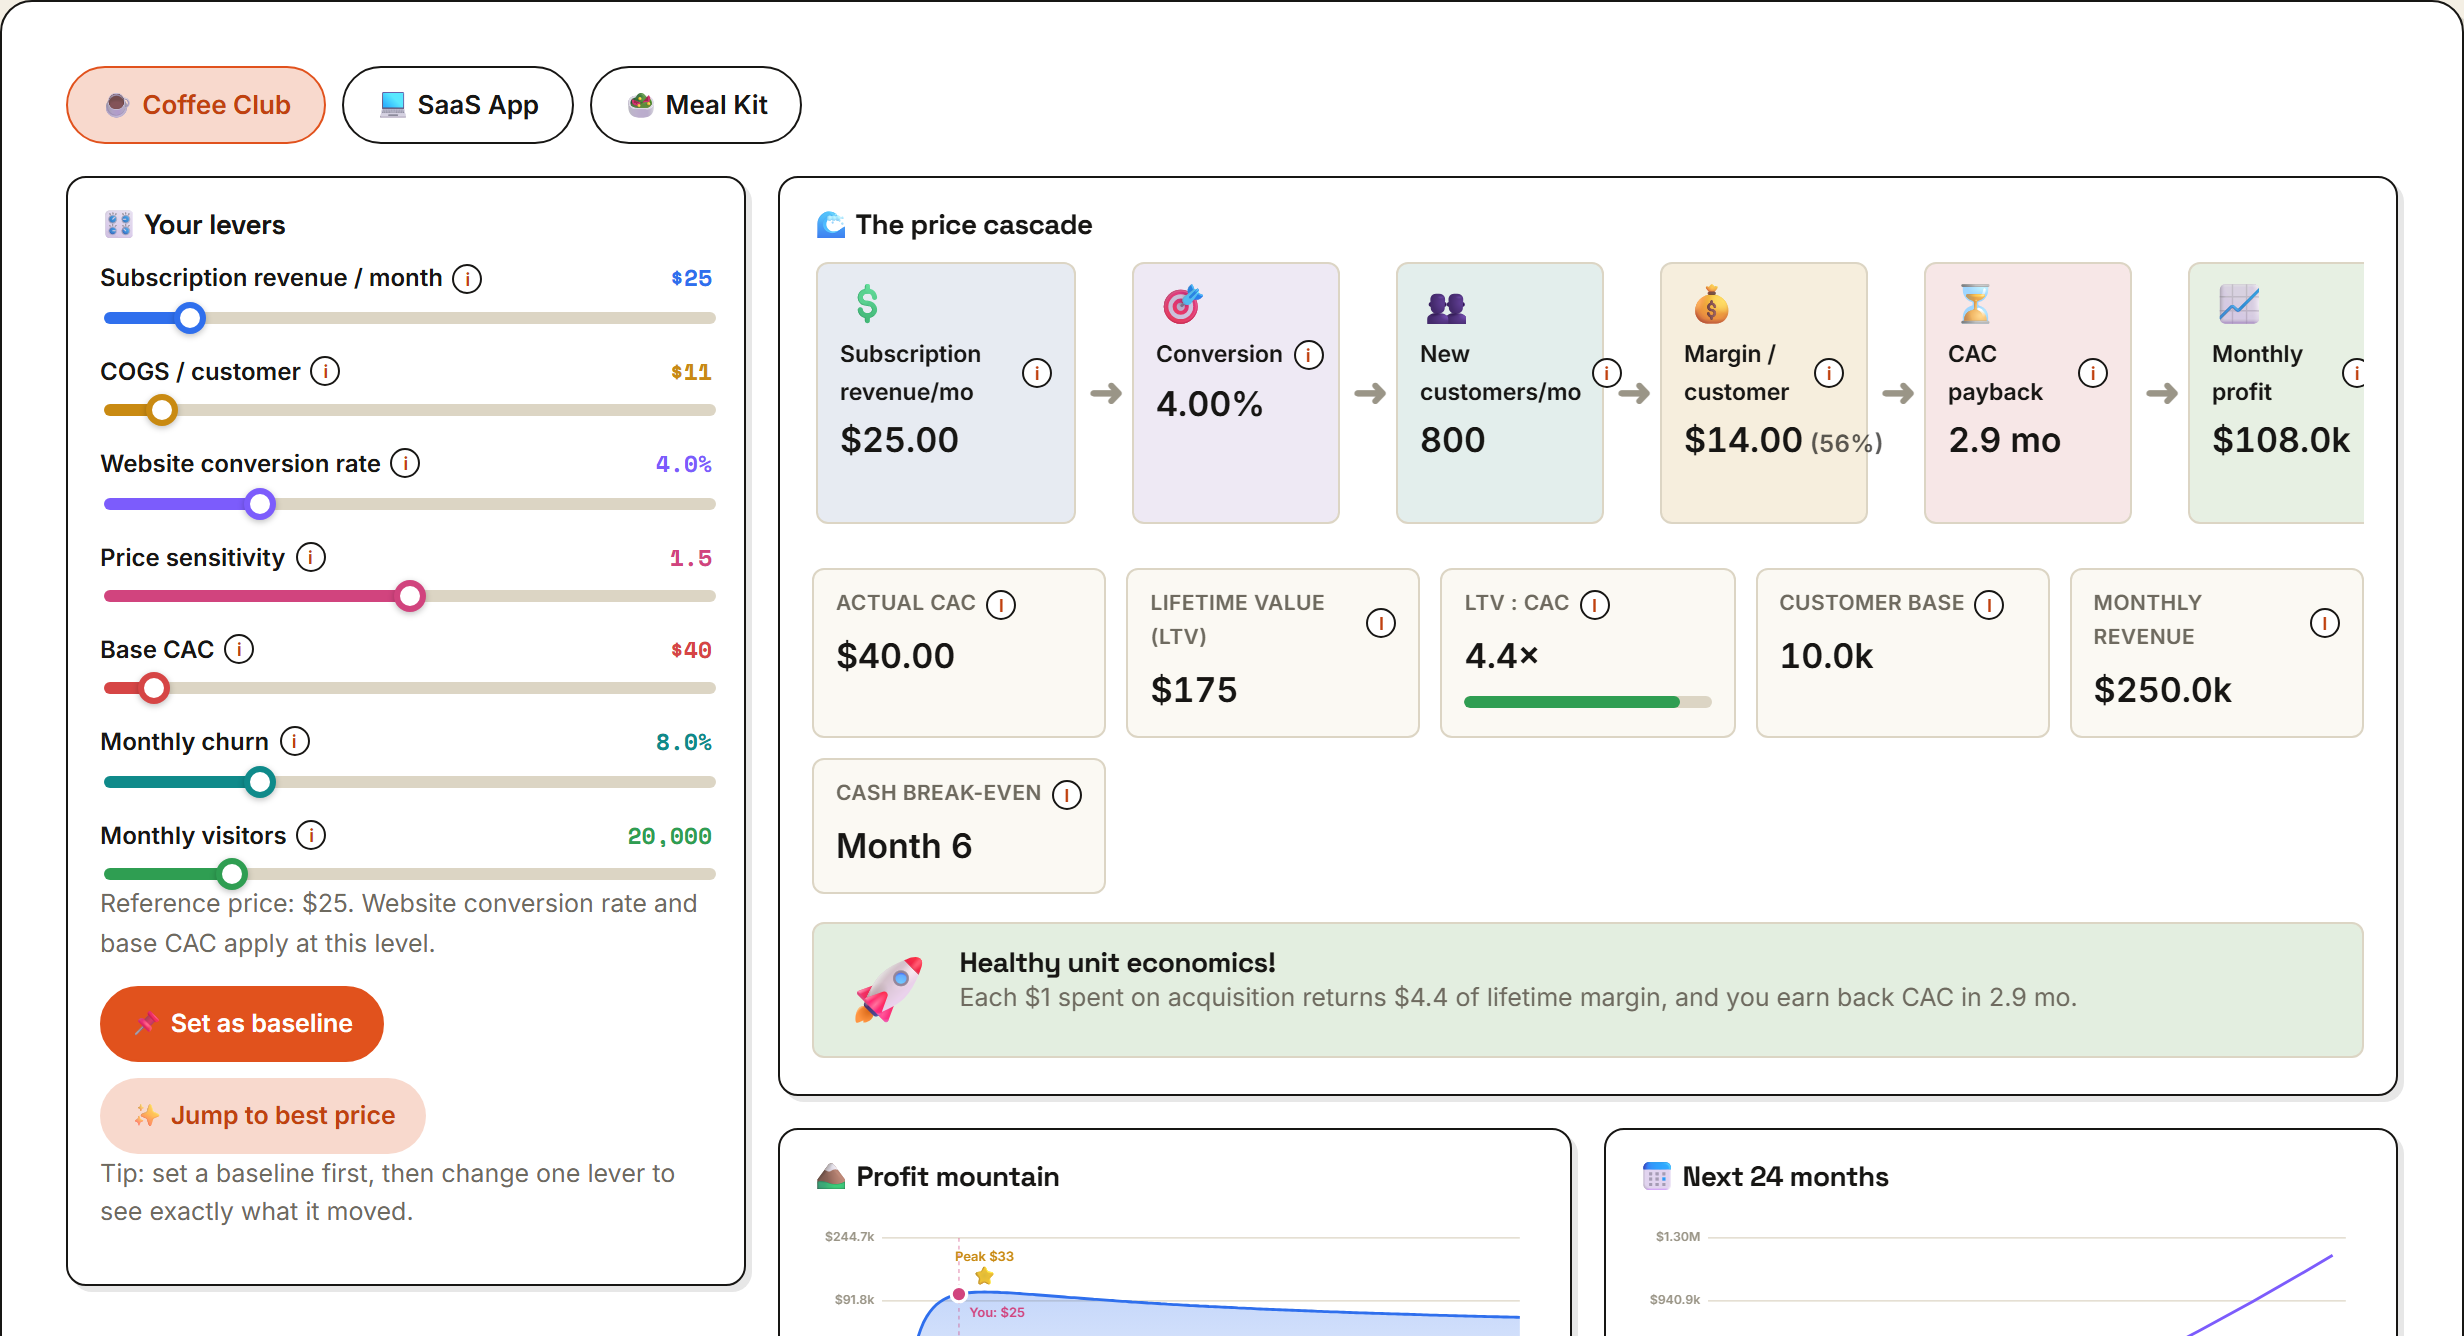
Unit Economics Explorer
A hands-on pricing simulator for a subscription business. Drag price, cost, conversion, acquisition cost, churn and traffic and watch the whole cascade react in real time, then read the payoff on a profit-vs-price 'mountain' and a 24-month cash projection. Switch between three preset businesses (a coffee club, a SaaS app, a meal kit), chase a challenge to find the peak-profit price, or work through ten guided experiments that isolate exactly what each lever controls.
Play with it →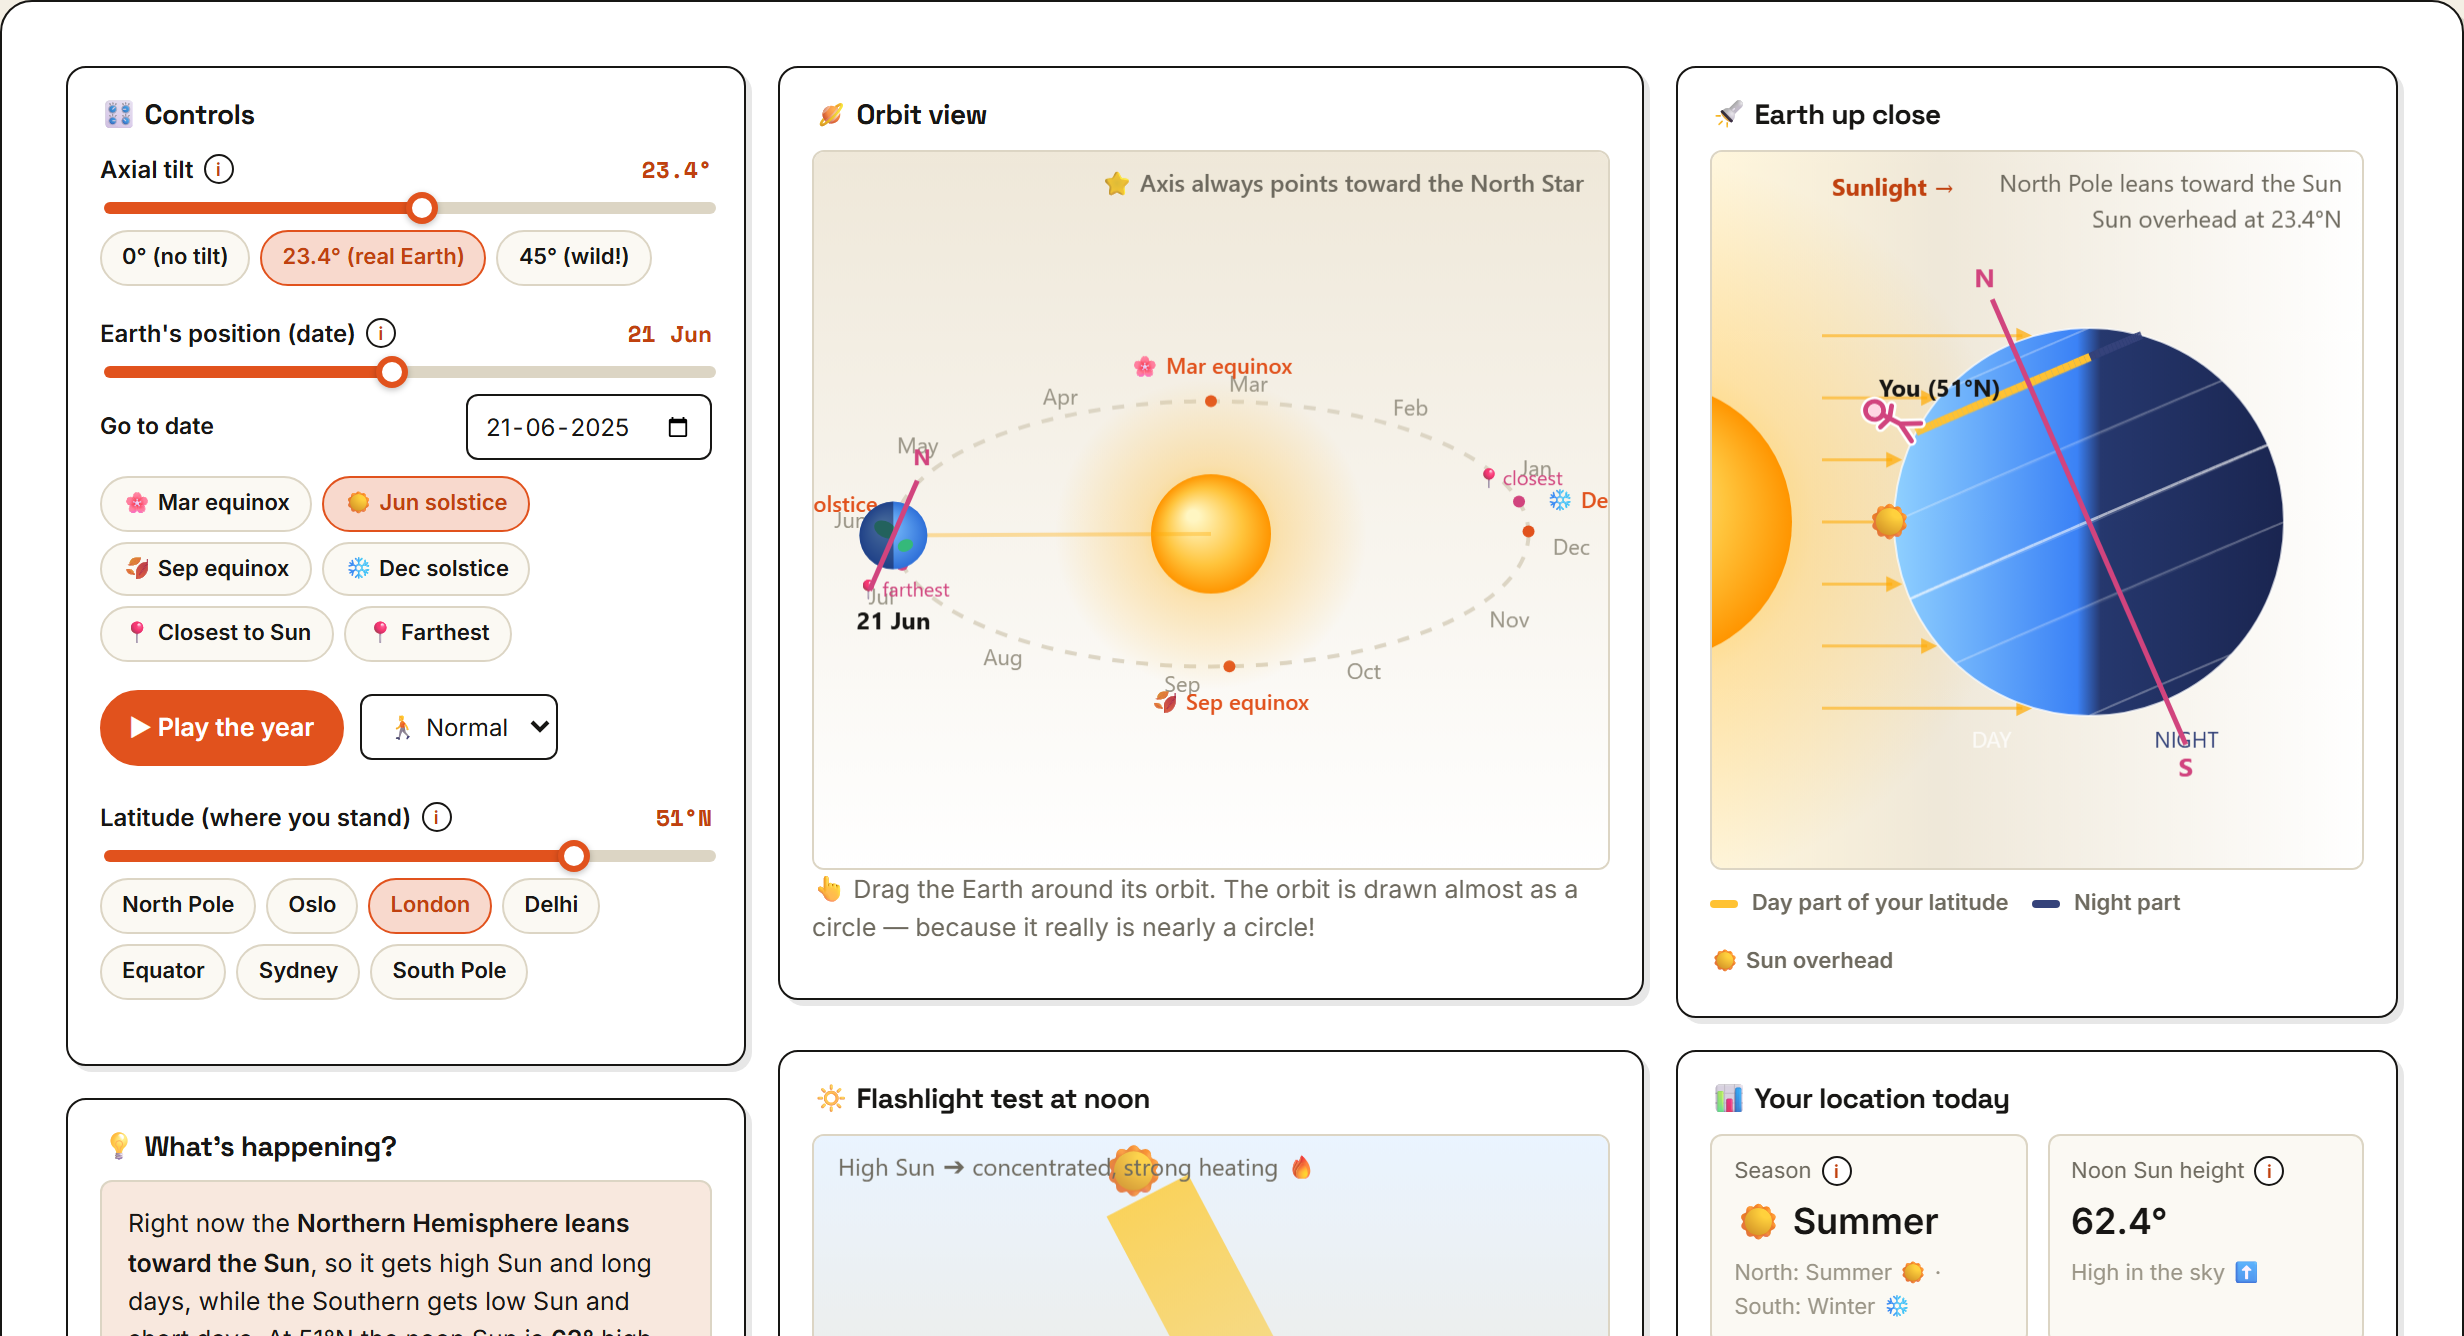
Earth's Seasons Simulator
A working model of Earth's yearly trip around the Sun. Change the axial tilt, drag Earth along its orbit (or press play), and pick a latitude to stand at, then watch an orbit view, a 3-D globe, a noon-Sun 'flashlight test' and a year-long daylight graph all update together. See noon Sun height, day length, sunlight received and distance to the Sun for your spot, complete five hands-on missions, and discover why Earth's tilt — not its distance from the Sun — is what actually causes the seasons.
Play with it →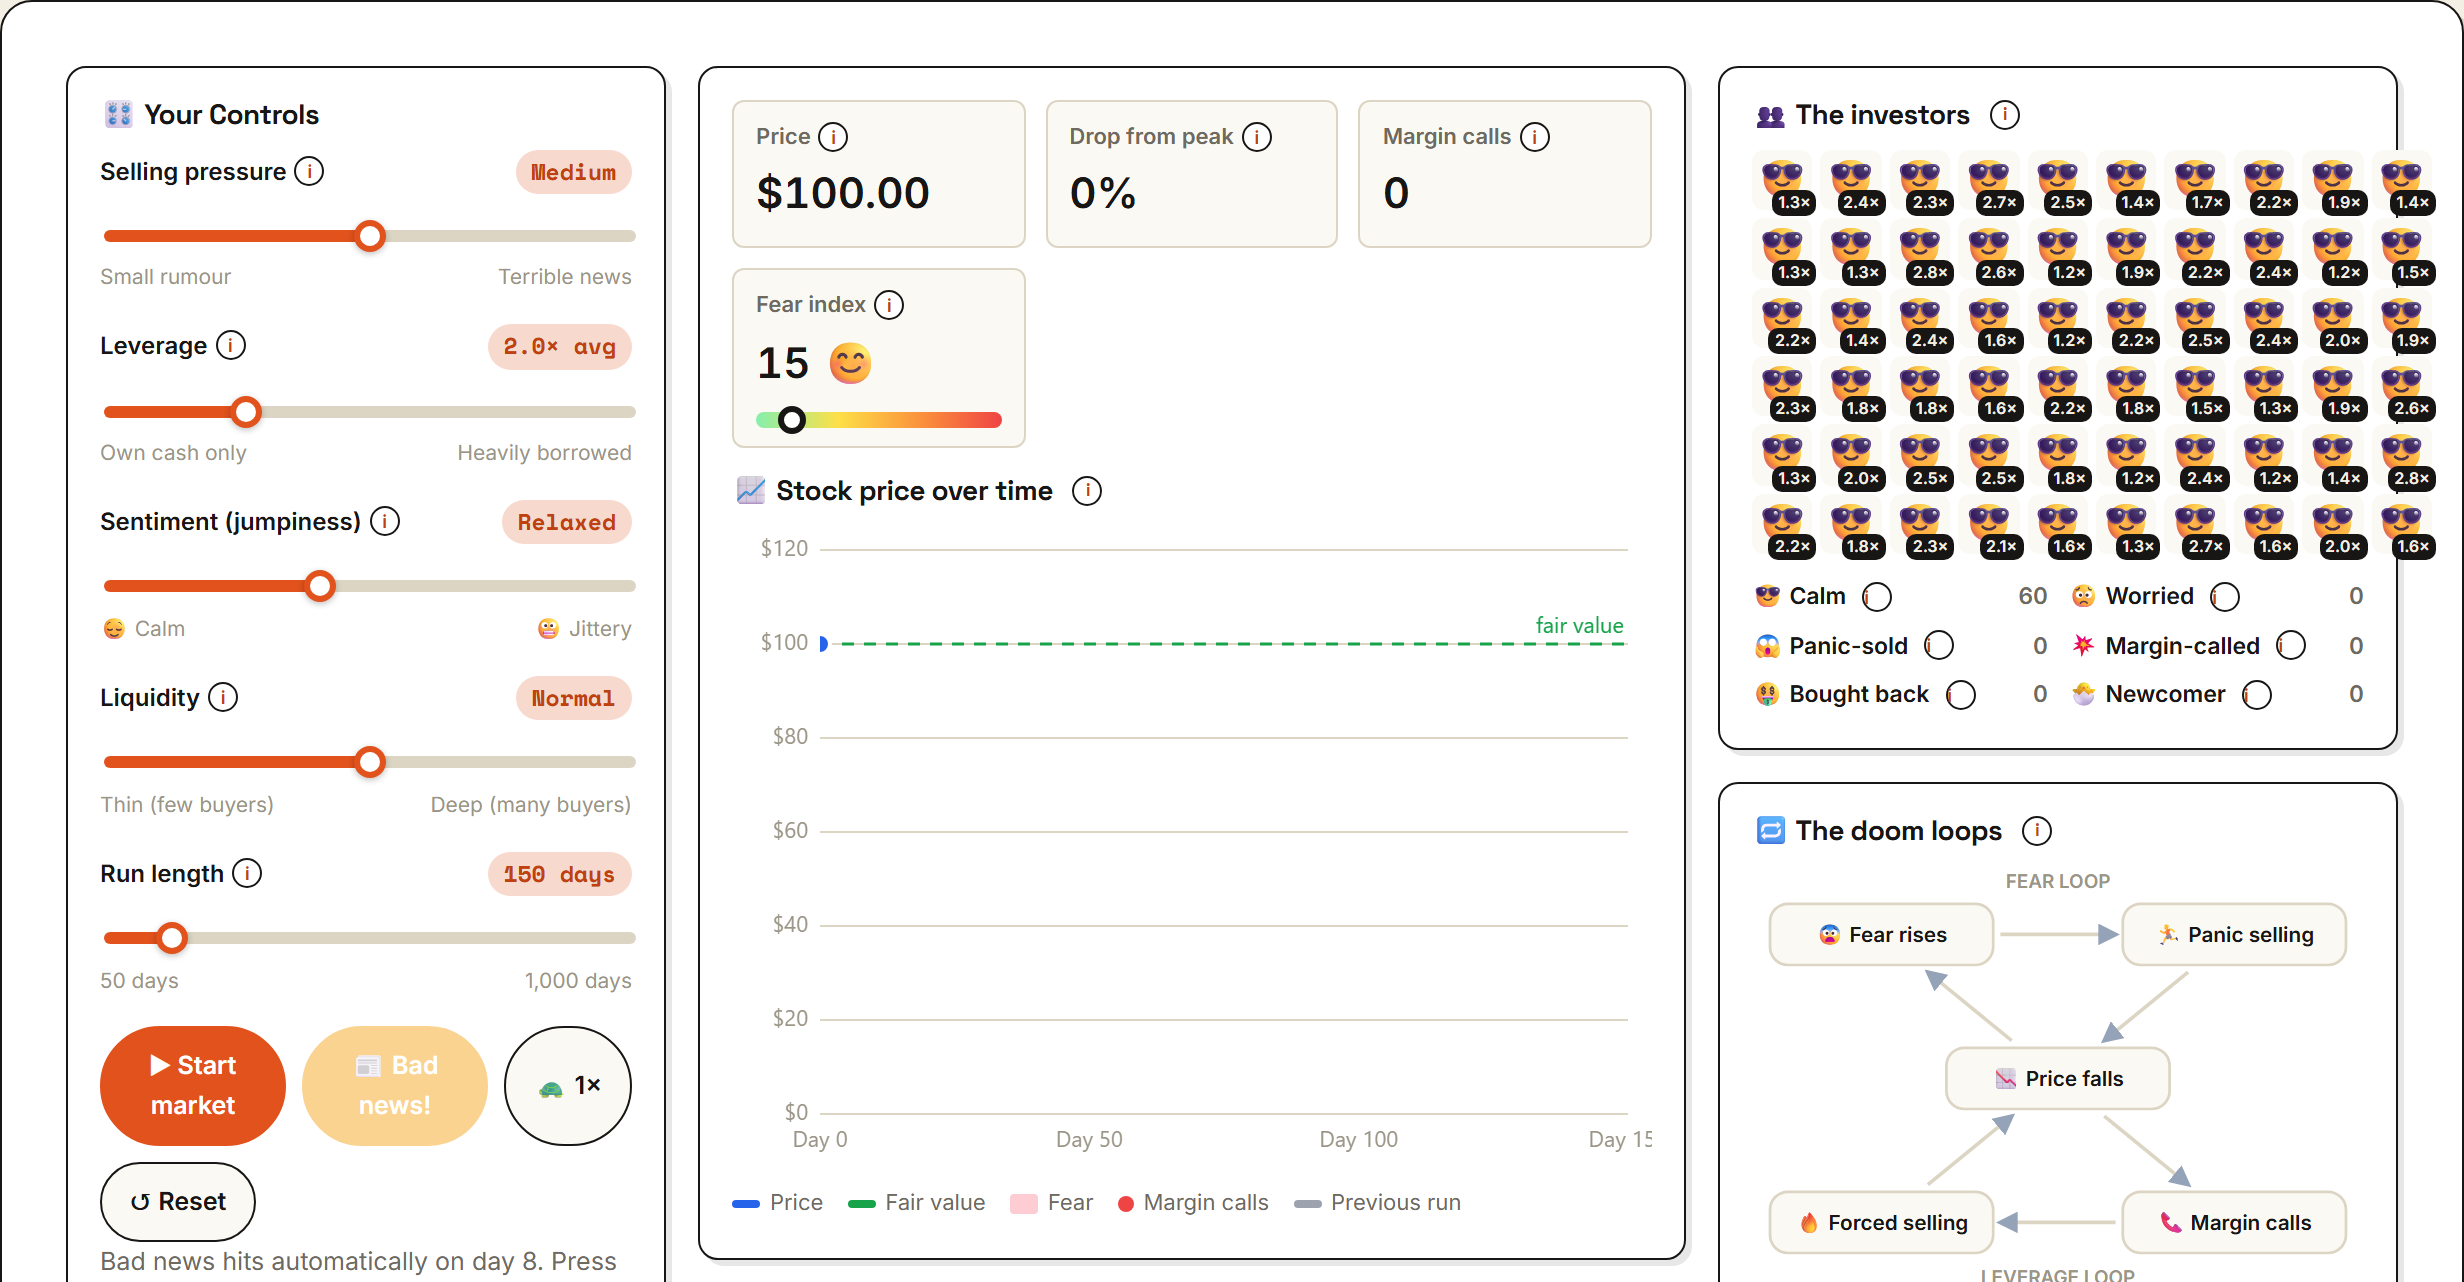
Market Crash Lab
An agent-based stock-market simulator: 60 investors each hold one $100 stock, and a news shock sets off a feedback loop between fear, panic selling and margin calls. Tune selling pressure, leverage, sentiment and market liquidity, watch the price chart, the crowd of investors, and a live doom-loop diagram react together, then read a report on how much of the fall came from news versus panic versus forced selling. Ten ready-made scenarios (from Calm & cash to Perfect storm) let you compare runs side by side.
Play with it →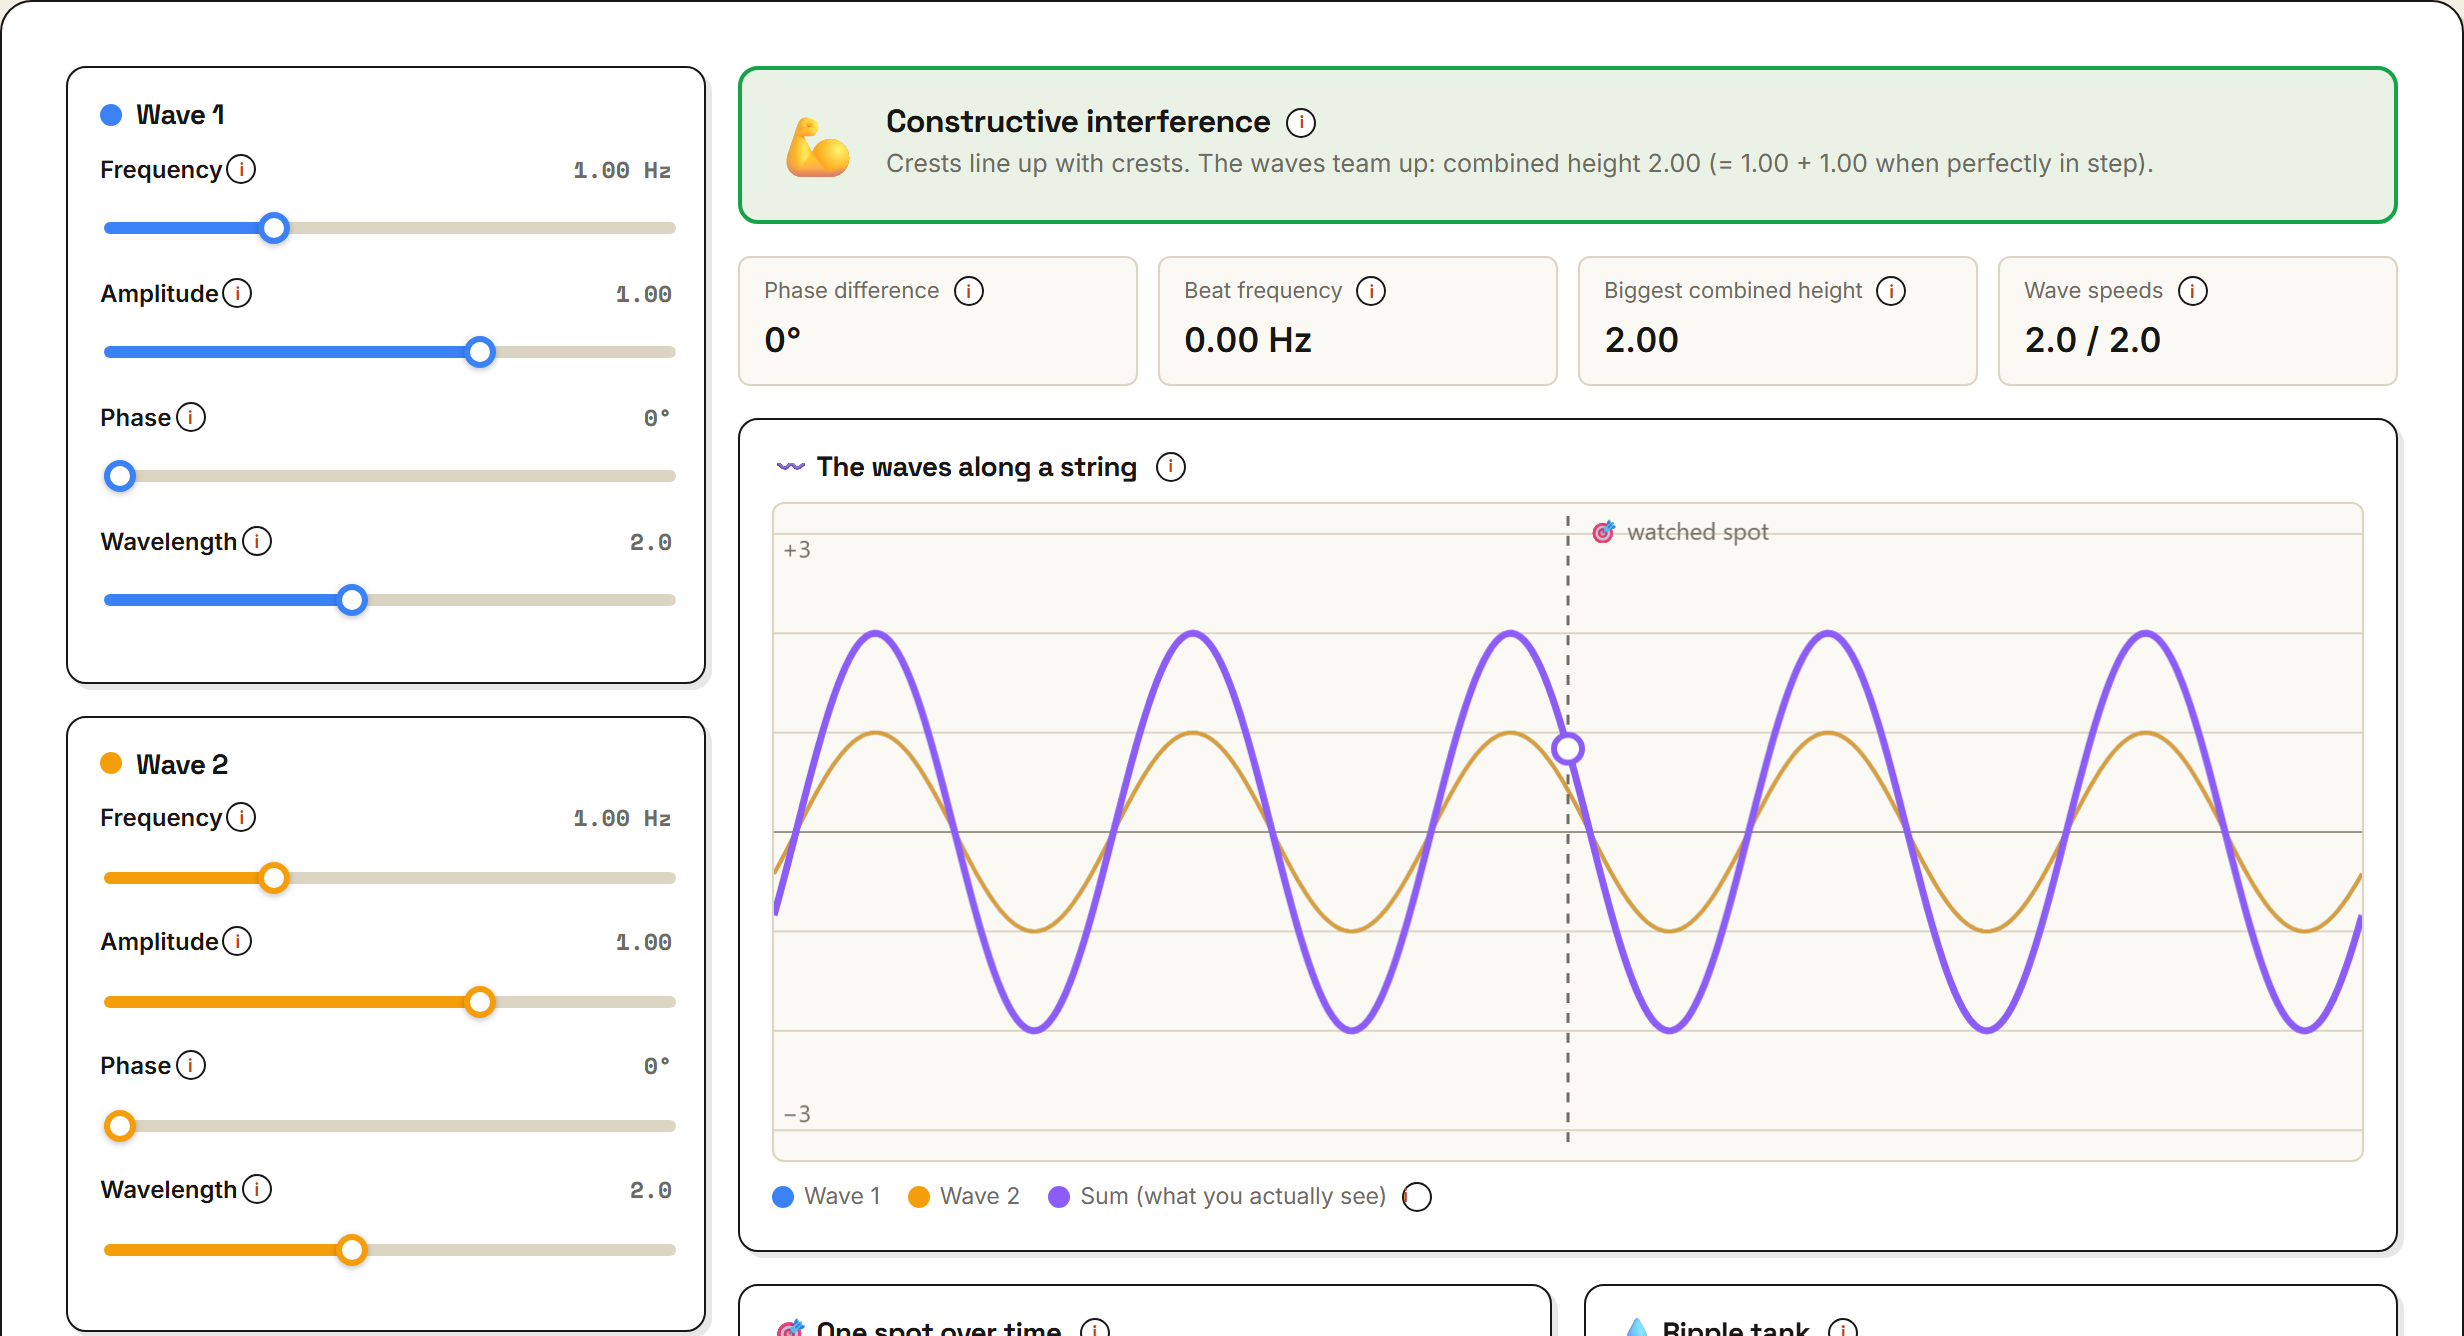
Wave Interference Explorer
Tune the frequency, amplitude, phase and wavelength of two travelling waves and watch superposition happen live: a snapshot of both waves along a string plus their sum, one spot's motion traced over time (with its beat envelope), and a top-down ripple tank with two draggable sources showing bright constructive lanes and calm nodal lines. A status banner and live numbers (phase difference, beat frequency, peak combined height, wave speed) explain what kind of interference is happening, and ten presets — from Team up and Cancel out to Beats, Octave and Stretch mismatch — jump straight to the key ideas.
Play with it →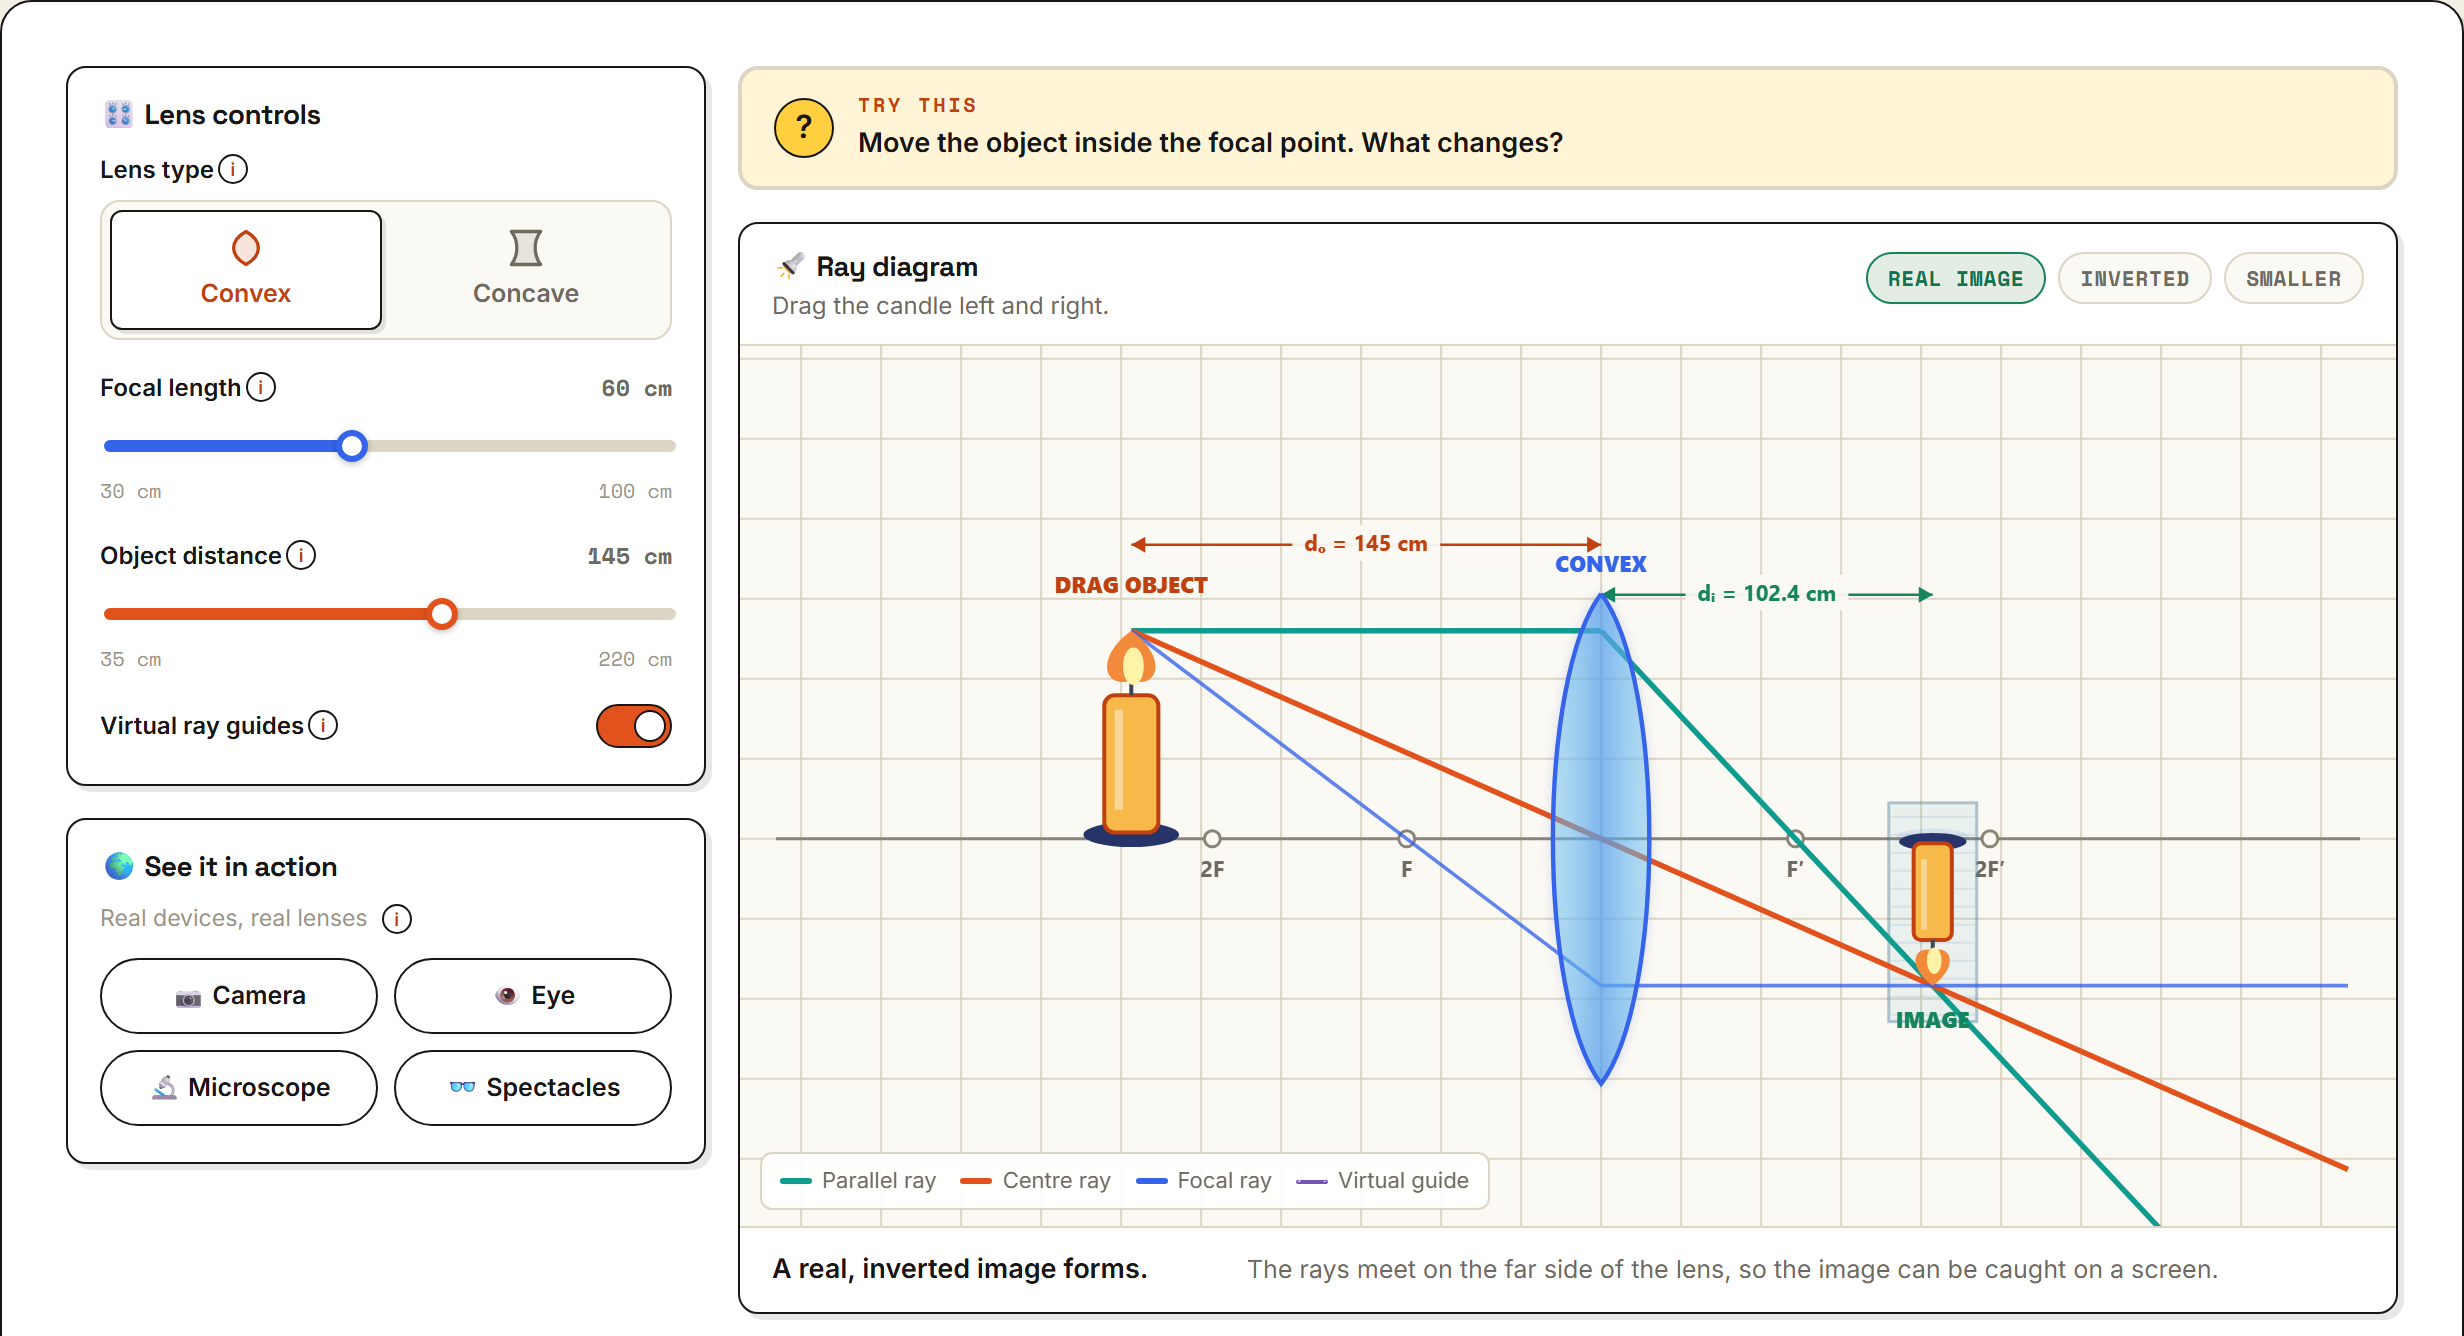
Lens Lab
Drag a candle toward and away from a convex or concave lens and watch the ray diagram redraw live: the parallel, centre and focal rays, the real or virtual image they form, and badges that say whether it is inverted, upright, larger or smaller. Tune the focal length and the object distance, switch on the virtual ray guides, and read off the image distance, magnification and lens power from the thin-lens equation. Four presets — camera, eye, microscope and spectacles — show how familiar devices put a lens to work.
Play with it →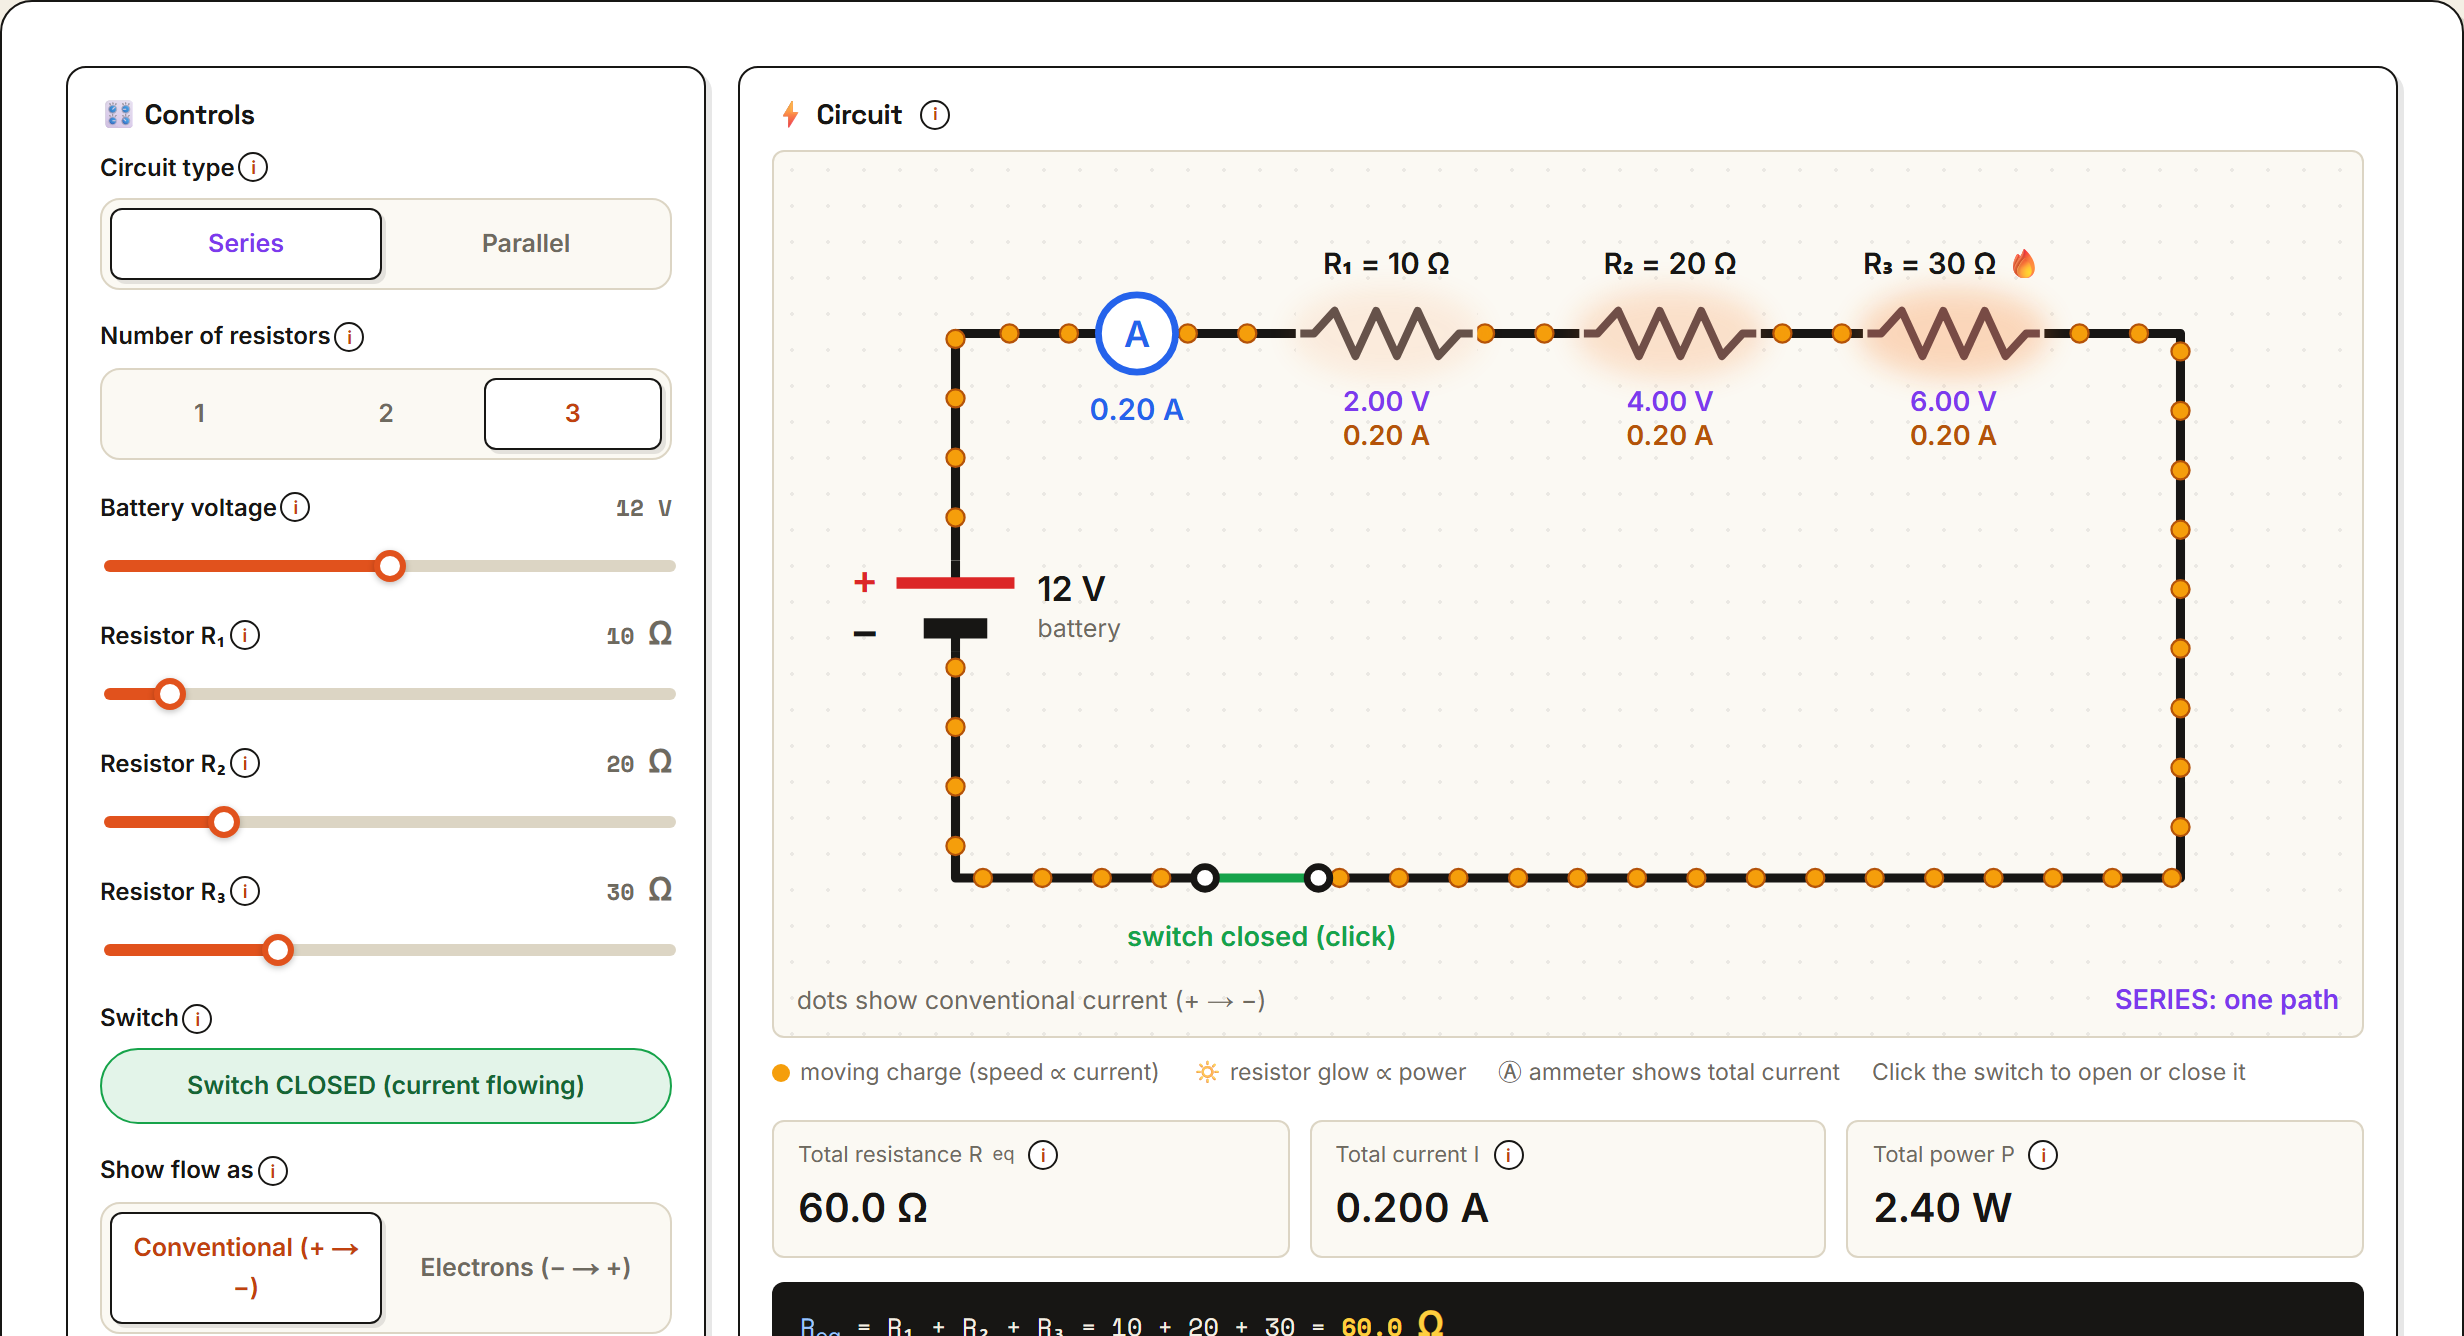
Electric Circuit Playground
Build a circuit with one to three resistors, wire them in series or in parallel, and turn the battery voltage up and down. A live diagram shows charge flowing (dot speed follows the current), resistors that glow with the power they burn, and an ammeter you can trust. Every resistor gets its own voltage, current and power readout, the working for R-equivalent and Ohm's law is shown step by step, and an I–V graph proves the straight line through the origin. Flip the switch to break the loop, or swap conventional current for electron flow.
Play with it →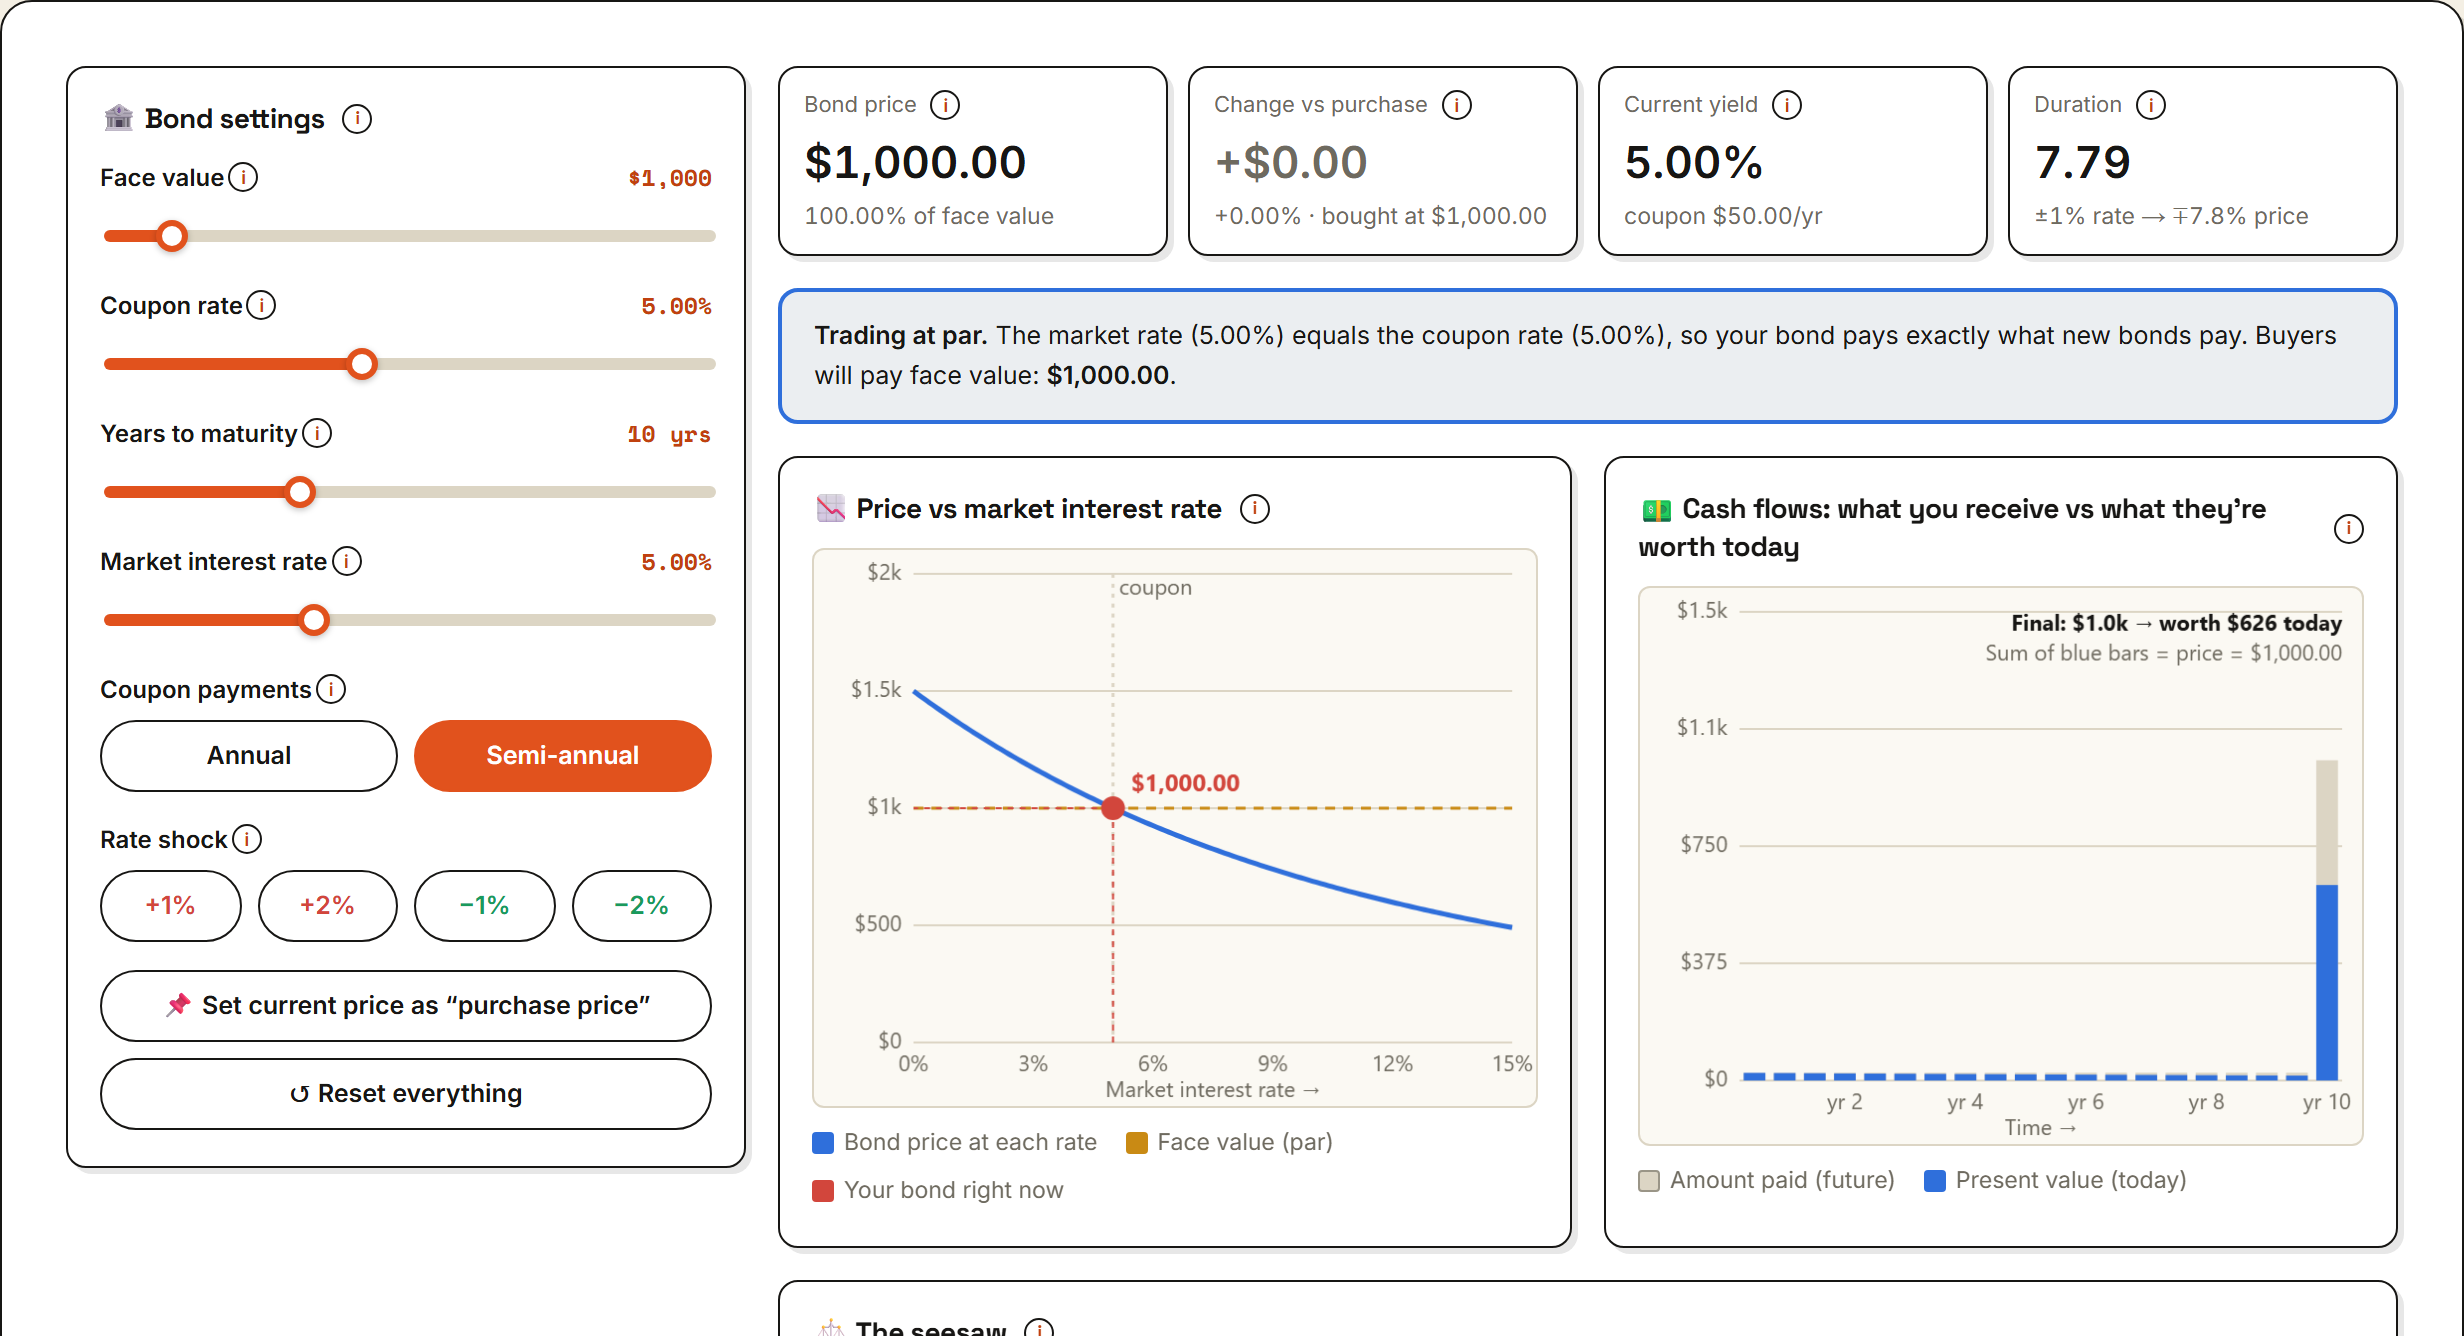
Interest Rates vs Bond Prices
Set a bond's face value, coupon rate, maturity and payment frequency, then push the market interest rate up and down. A price-versus-rate curve, a cash-flow chart that shows every payment shrinking to its present value, and a seesaw make the inverse relationship impossible to miss. Live readouts give the price, your paper gain or loss since you pinned a purchase price, the current yield and the duration, while +1% / +2% / −1% / −2% rate-shock buttons reveal why long, low-coupon bonds swing hardest and why the curve bends (convexity).
Play with it →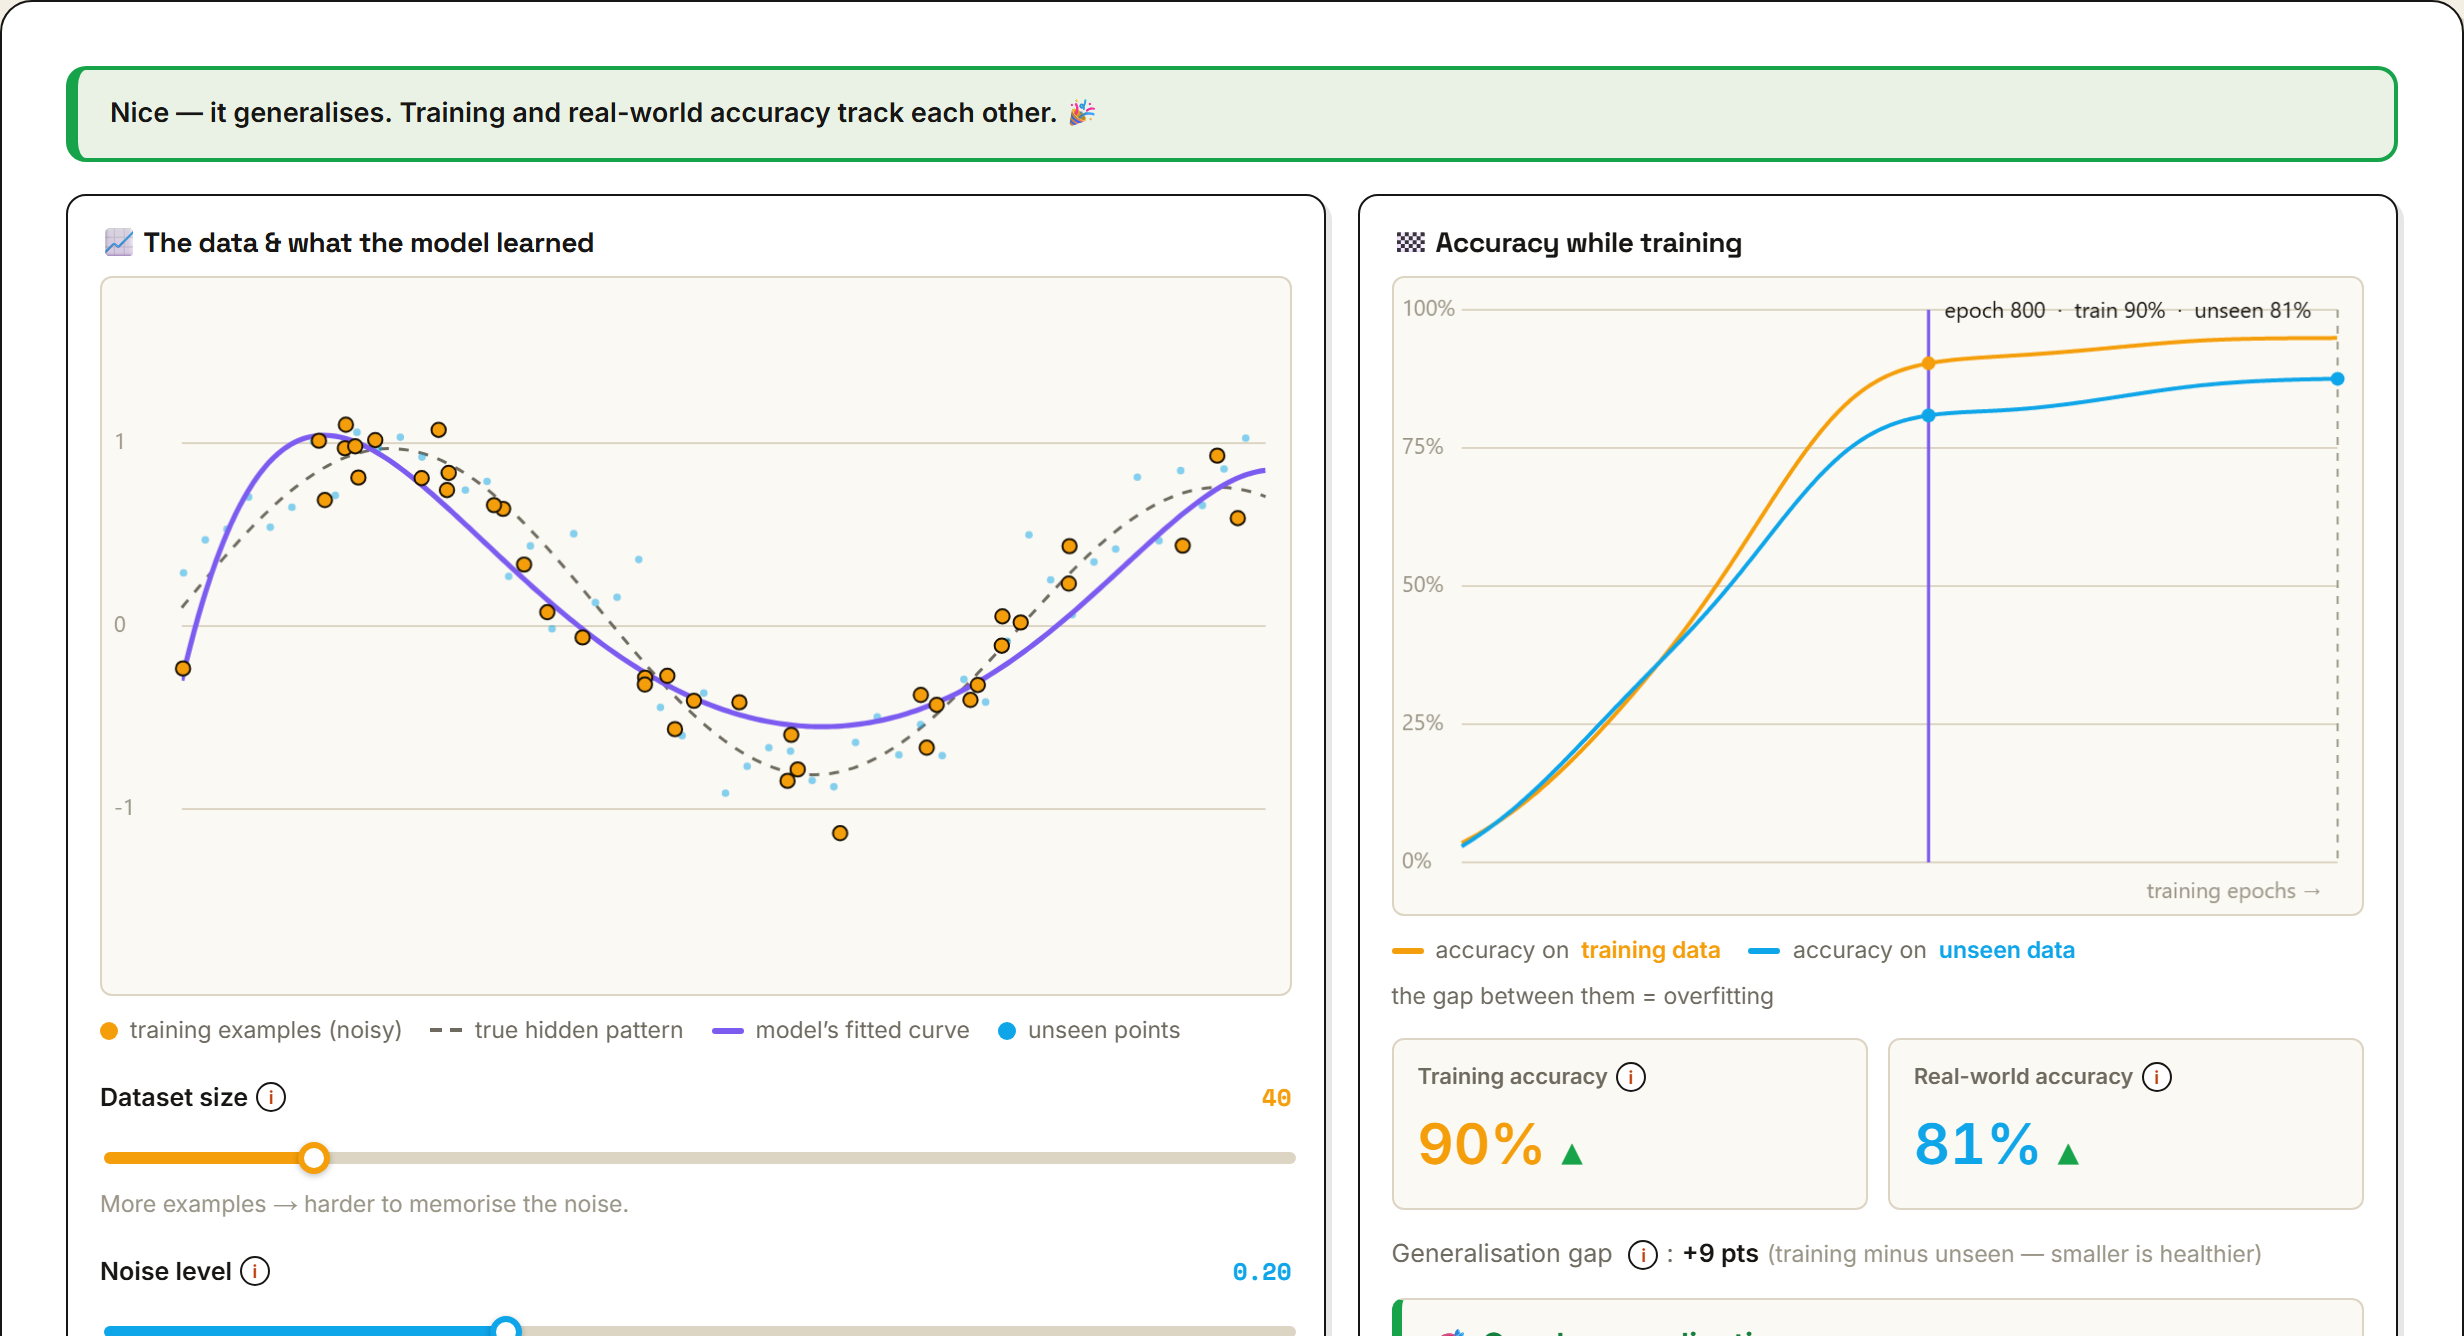
Overfitting Playground
Fit a polynomial model to noisy data and play with four dials — dataset size, noise level, model complexity and training epochs — while a live plot shows the curve the model learned against the hidden true pattern and a set of unseen points. A learning-curve chart tracks training accuracy against real-world accuracy epoch by epoch, marks the sweet spot for early stopping, and shades the overfitting zone. Readouts, a generalisation-gap meter and a plain-English verdict say whether the model is underfitting, generalising well or overfitting, and one-click presets jump straight to each case.
Play with it →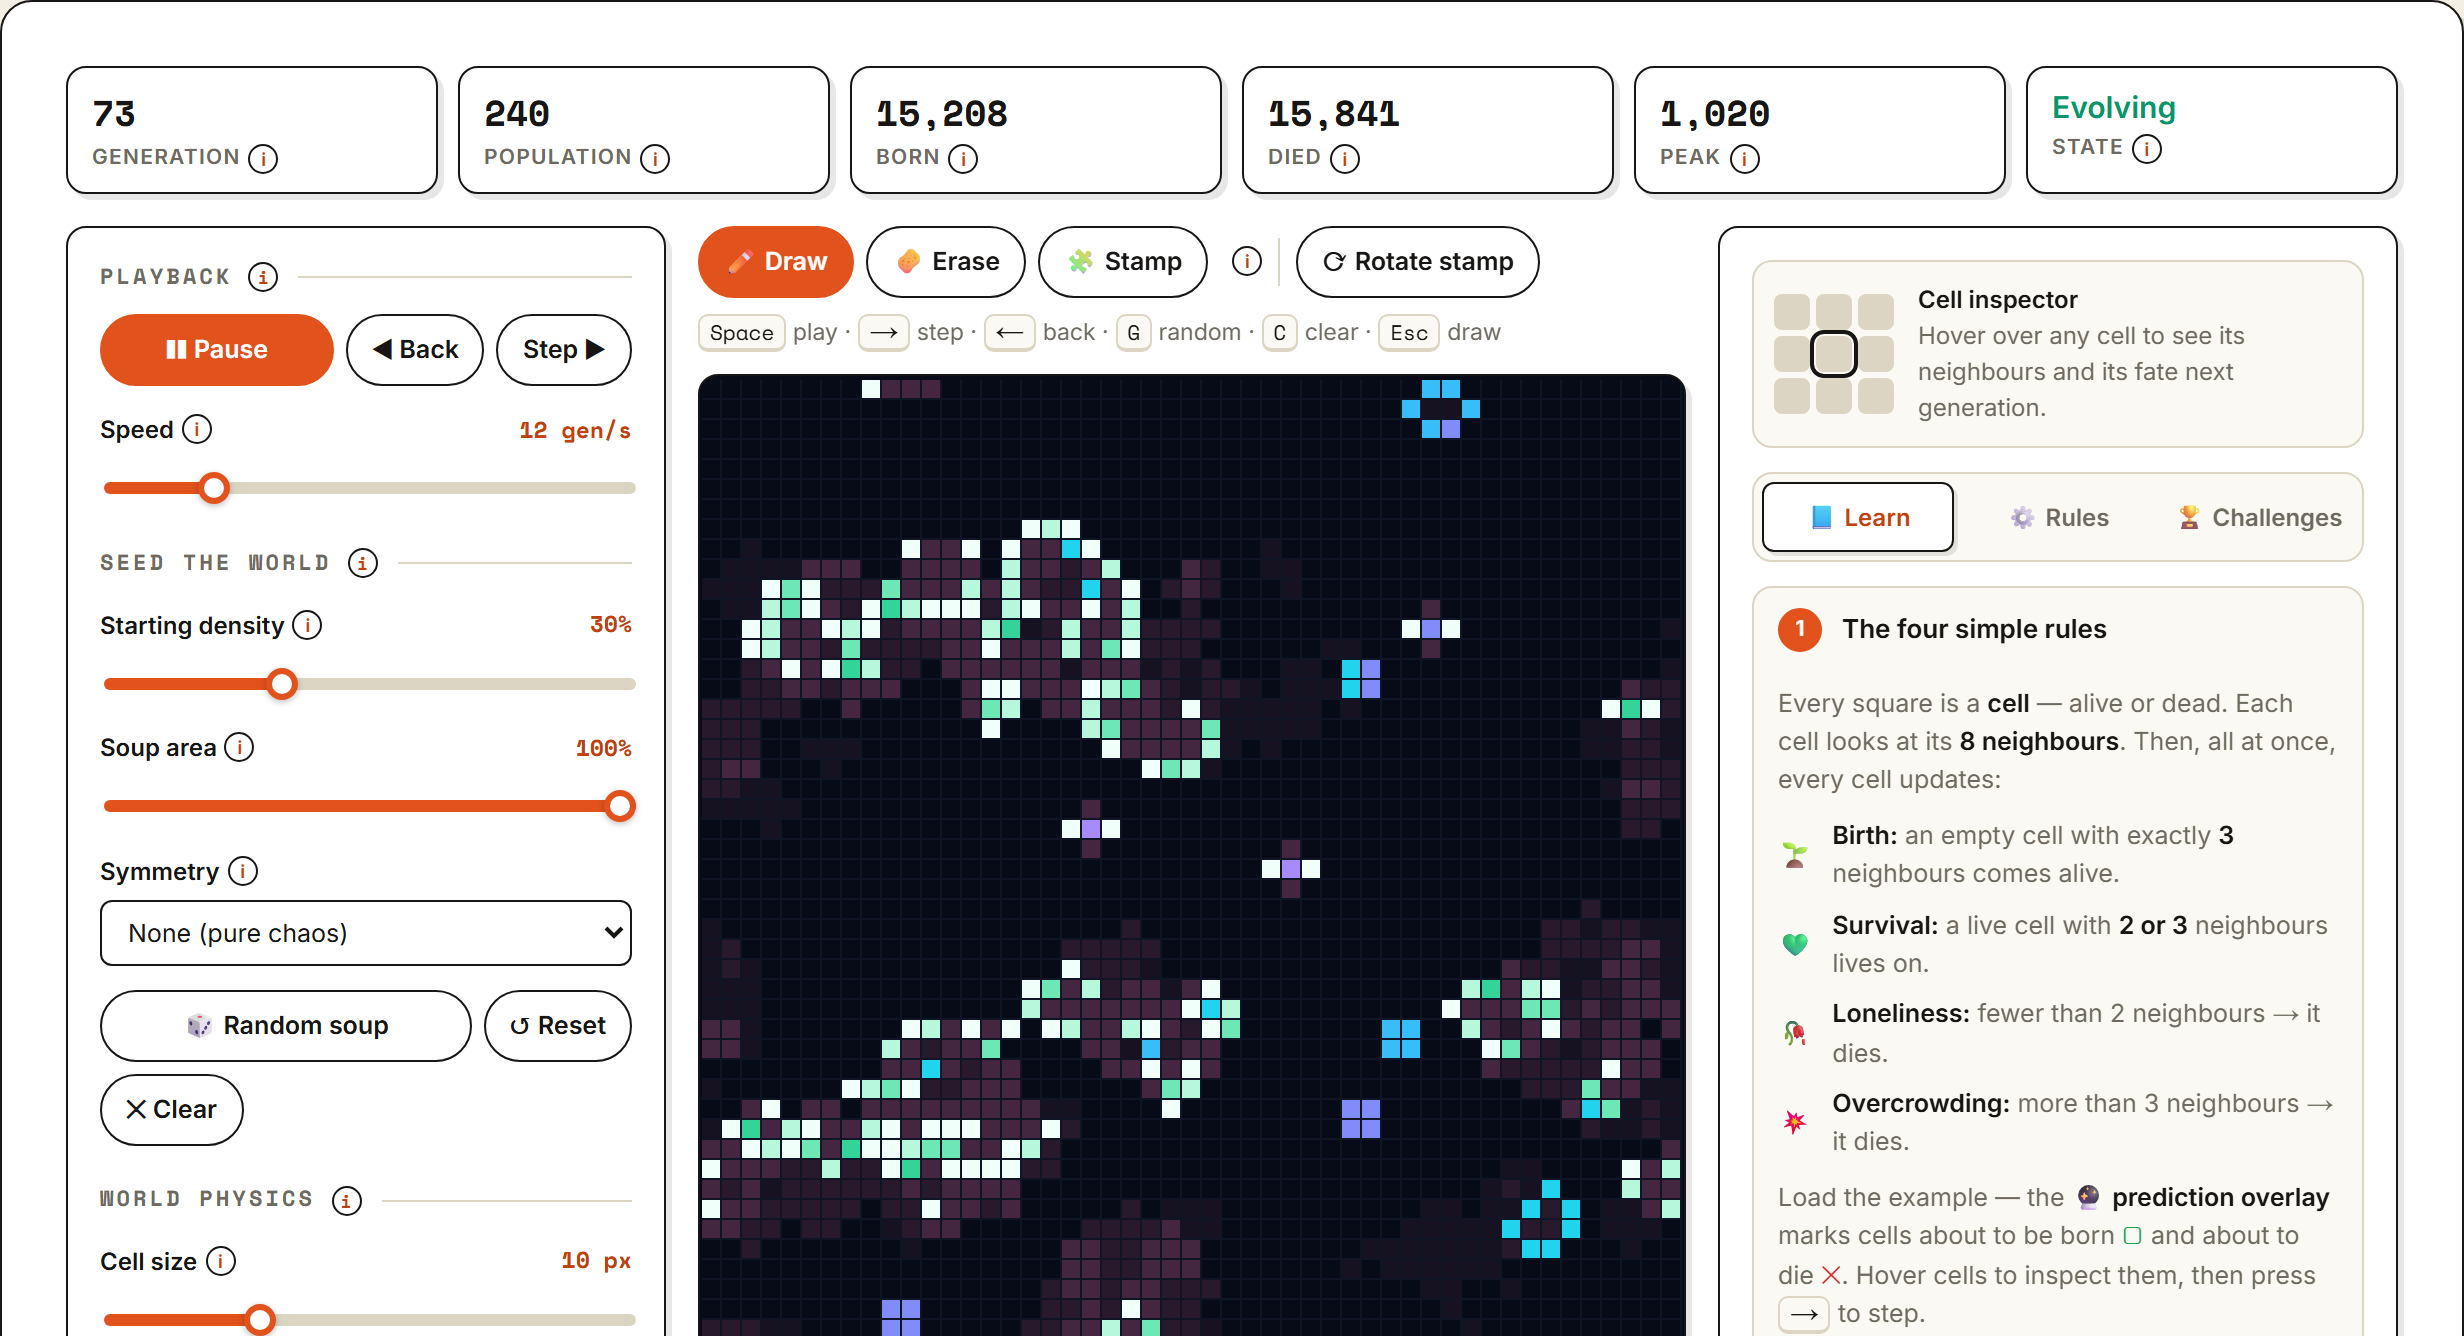
Life Lab: Conway's Game of Life
Draw cells, drop in famous patterns (gliders, pulsars, the Gosper gun, the R-pentomino…) and watch Conway's rules play out live on a wrap-around world. Step forwards and back, switch on the prediction overlay to see which cells are about to be born or die, hover any cell to see exactly why, and follow the population chart as the world boils, cools and settles. Change the birth and survival numbers to invent other universes (HighLife, Seeds, Day & Night, Maze…), turn on mutation to watch sturdy patterns survive, work through eight guided lessons, and try five build-it-yourself challenges.
Play with it →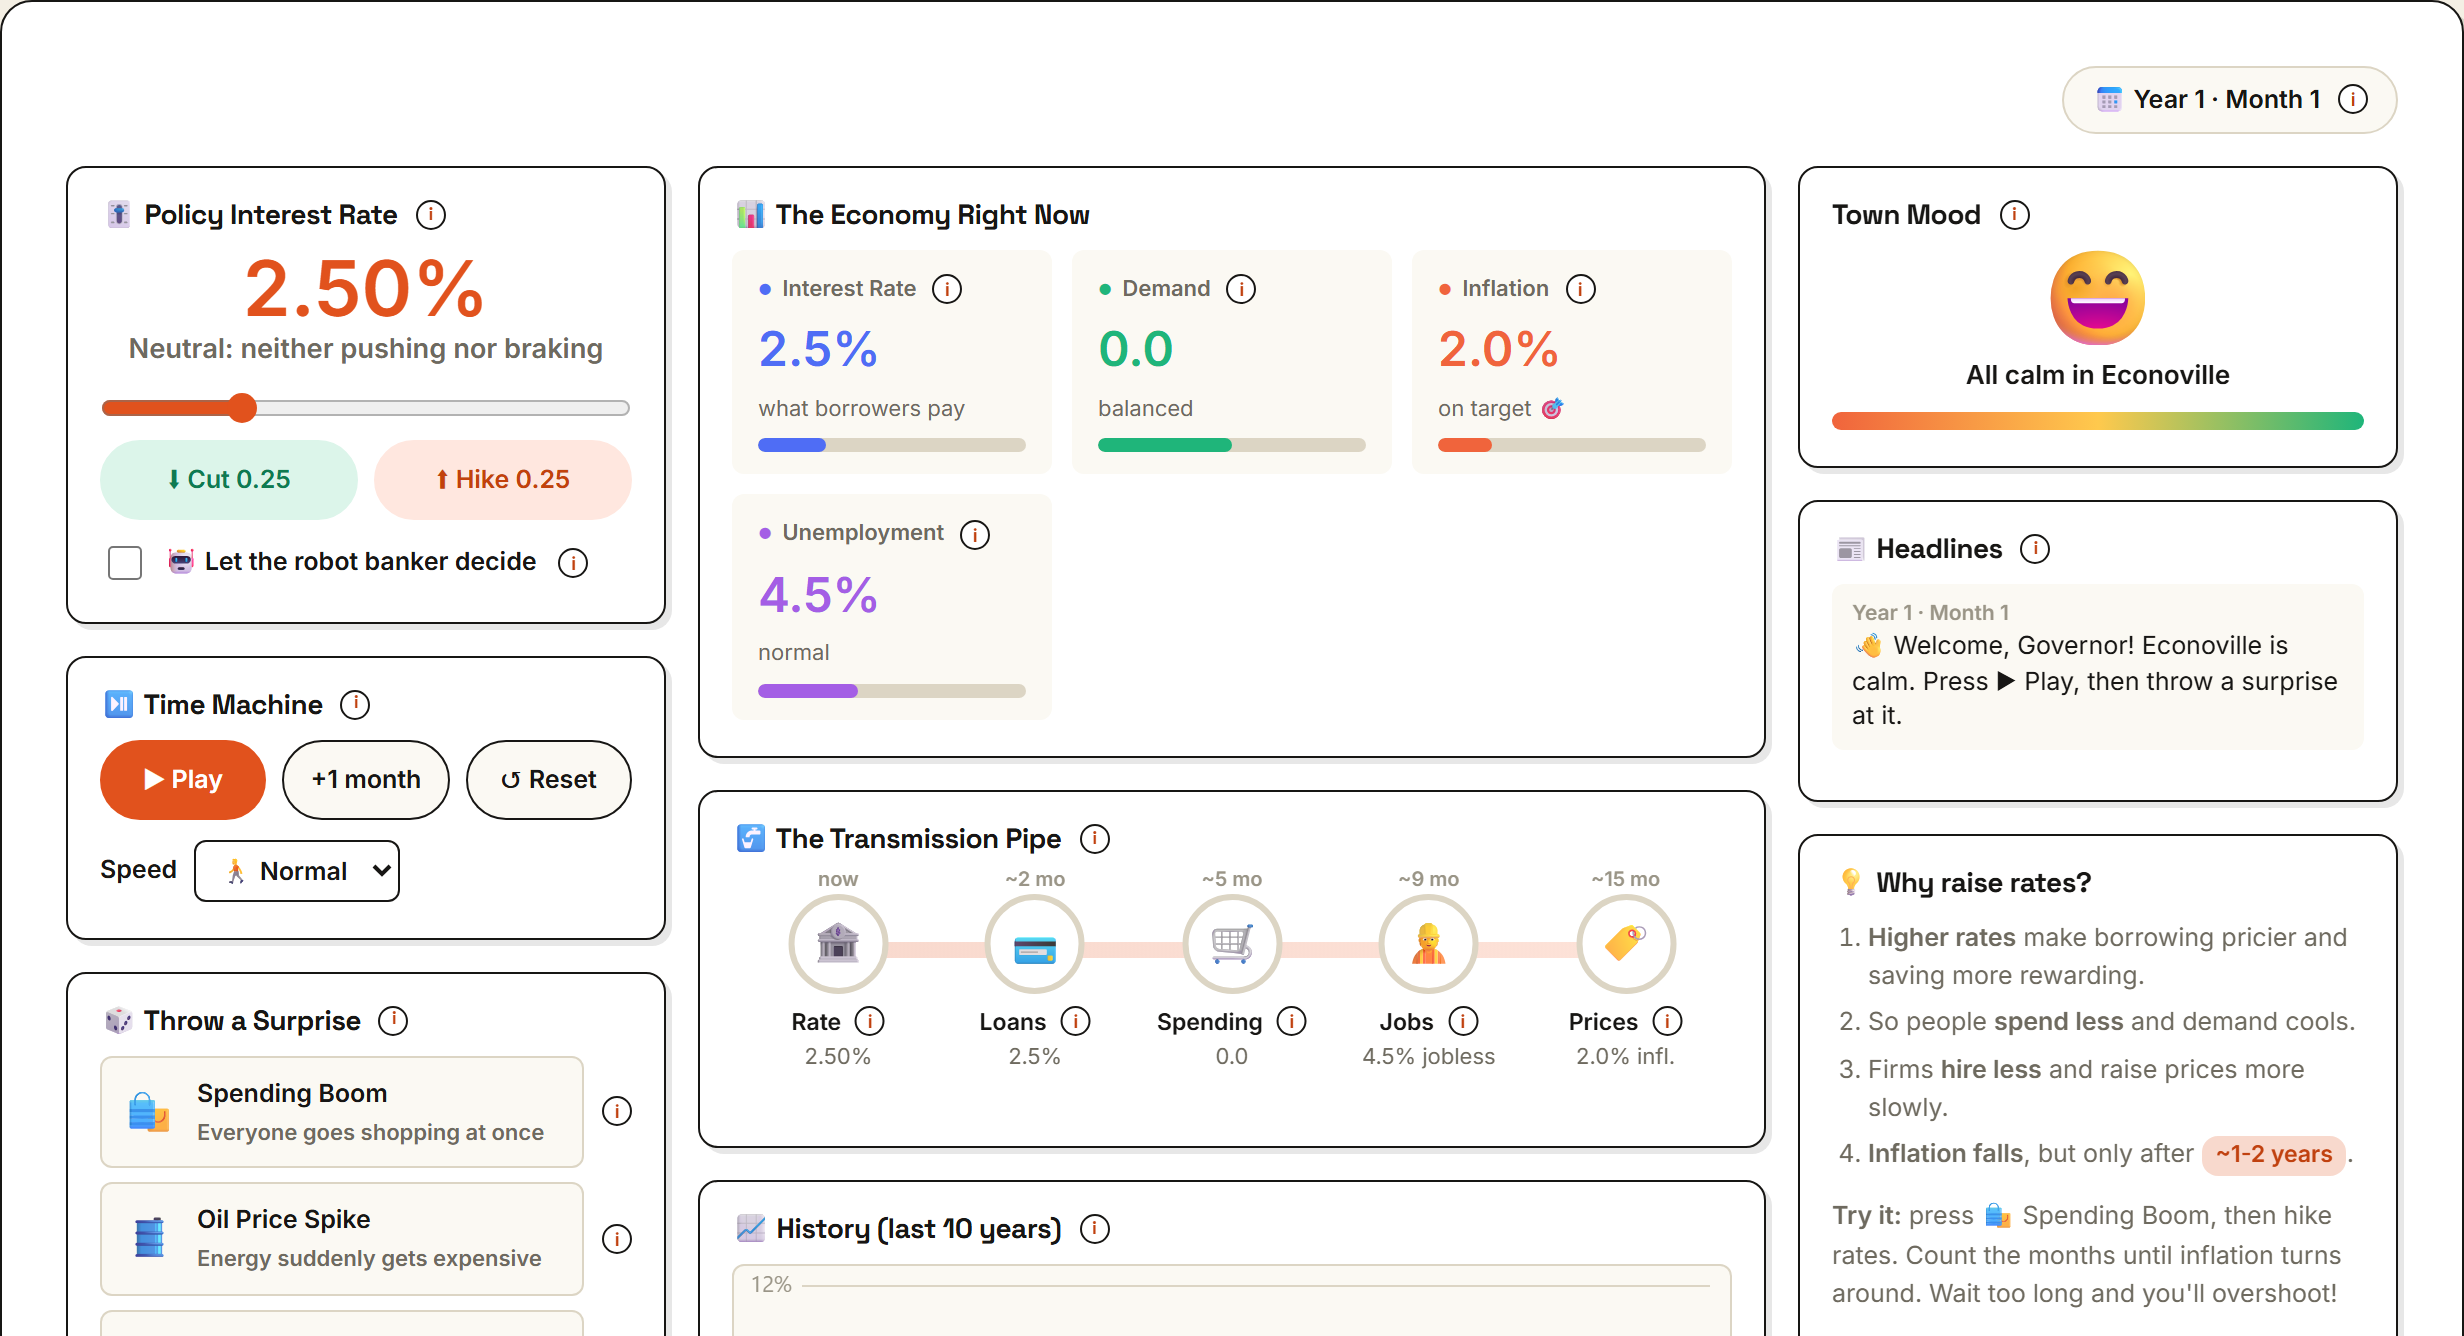
Rate Lab
A toy economy you run as central bank governor. Move the policy interest rate (or let a Taylor-rule robot banker do it) and watch it travel down a five-stage transmission pipe — loans, spending, jobs, then prices — each with its own lag, while demand, inflation, unemployment and the town's mood update live on gauges, a history chart and a running headline feed. Throw a spending boom, an oil shock or a confidence crash at the economy, or load one of ten scenarios (from a gentle Recession Rescue to the Volcker Cure and Stagflation) to see why central banks must act early, why effects lag by a year or more, and why overshooting causes recessions.
Play with it →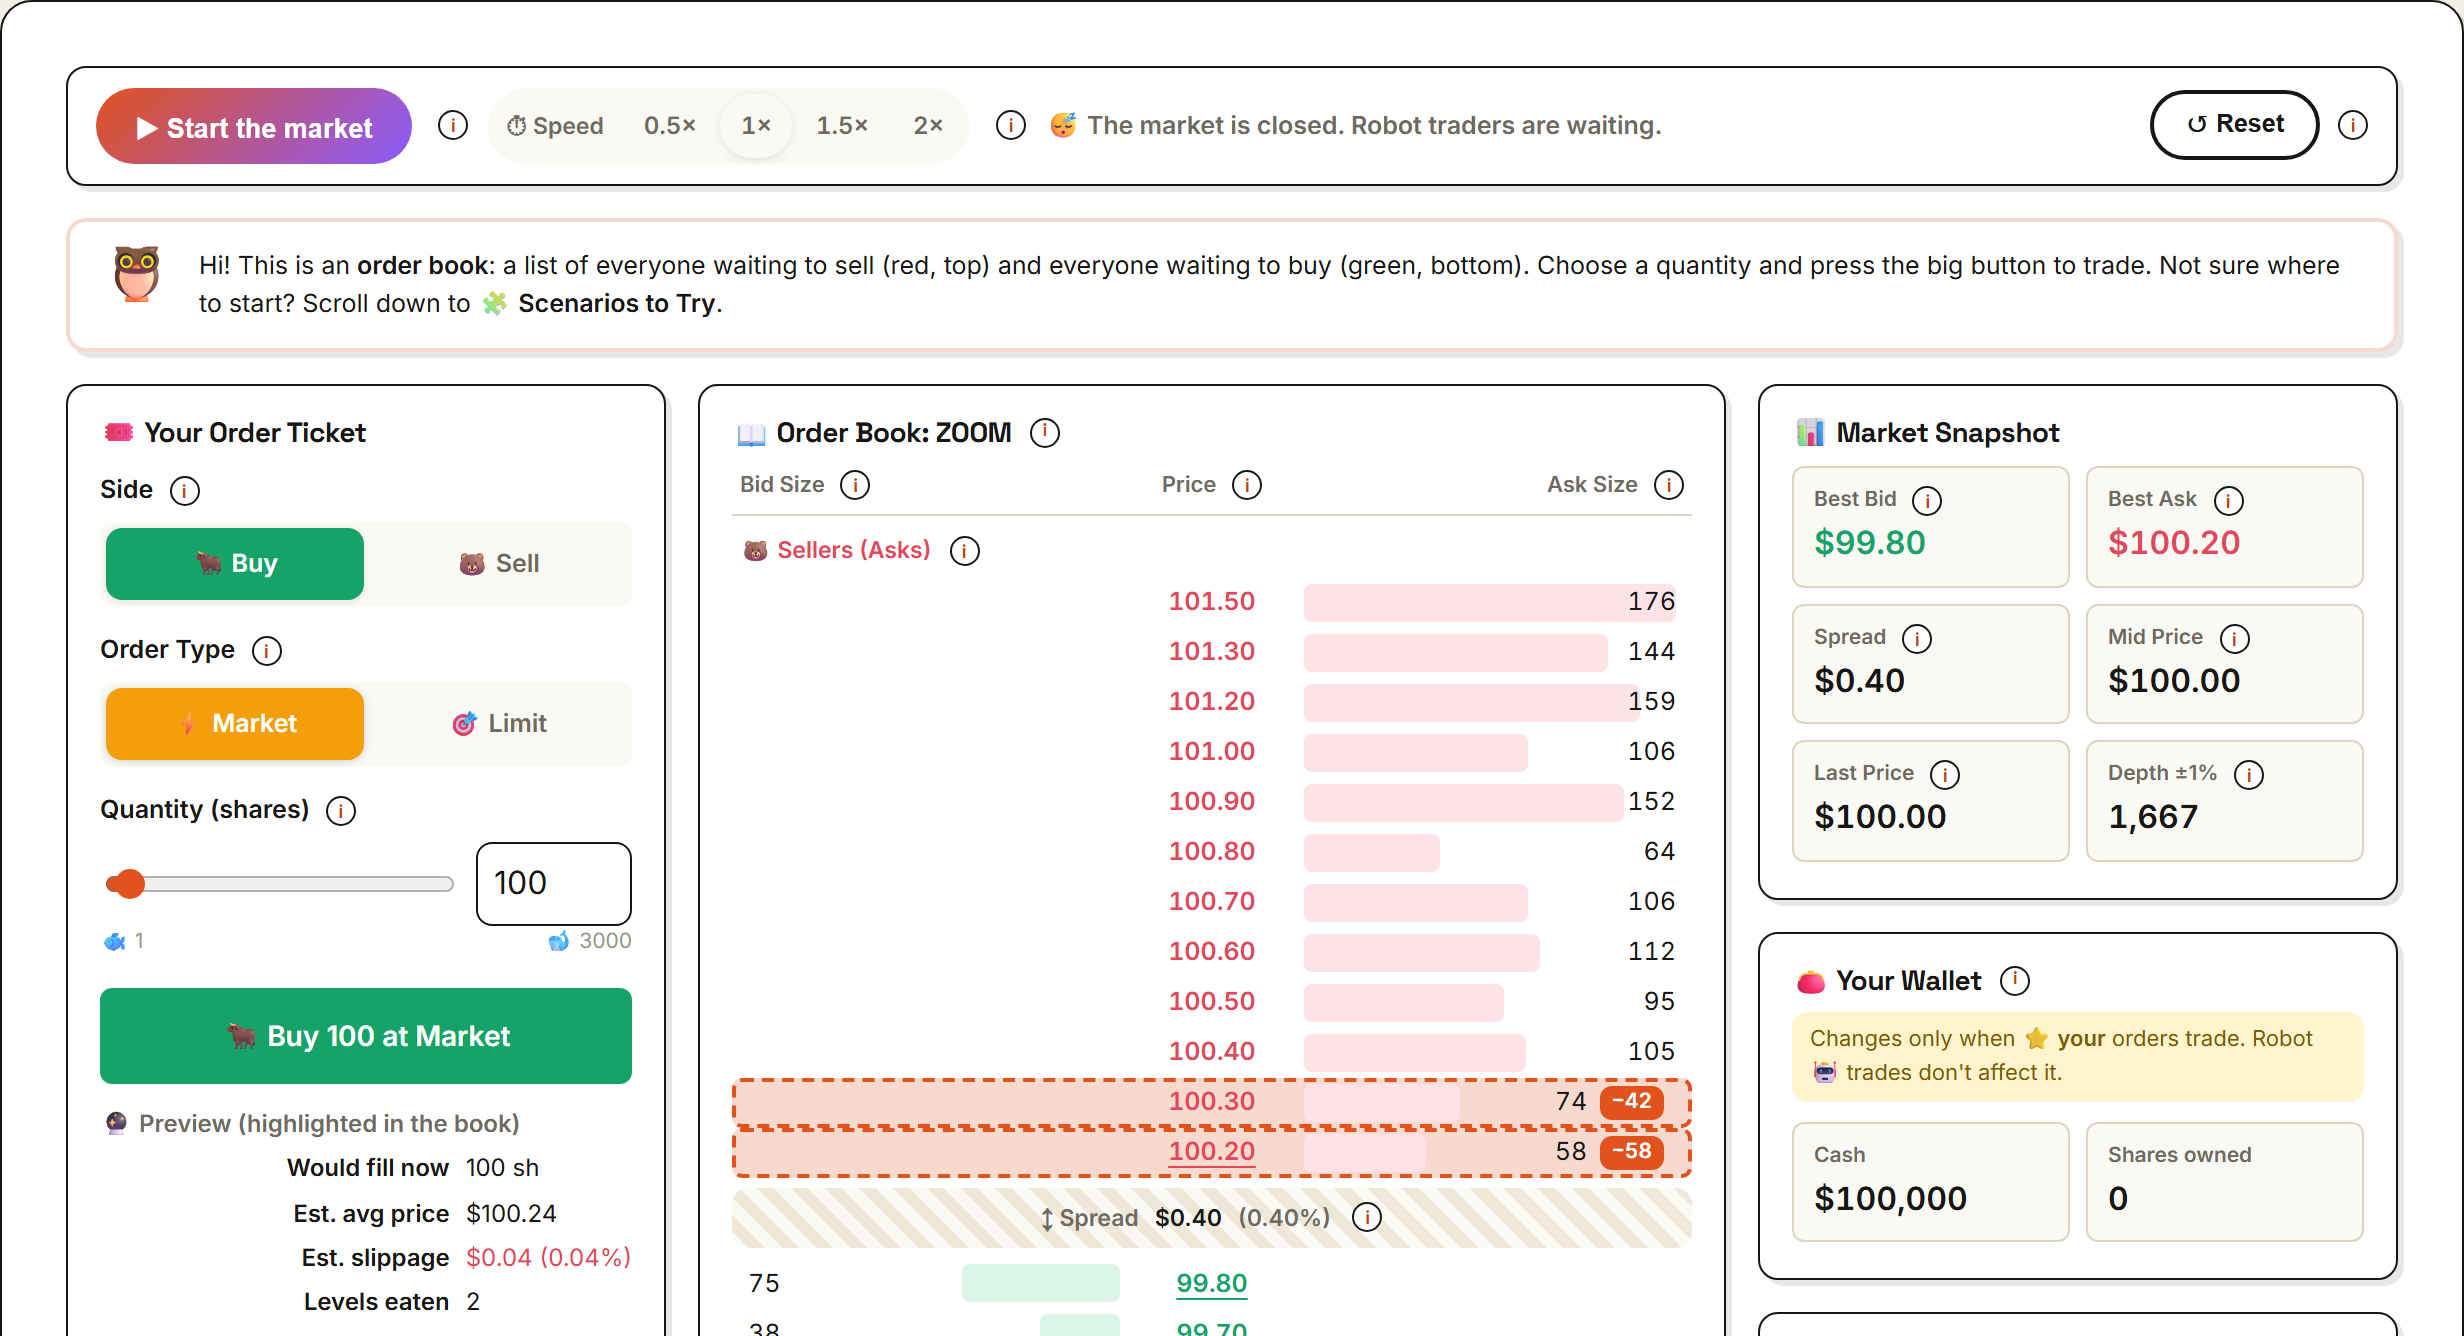
Order Book Playground
A live limit order book with a real price-time-priority matching engine. Place market or limit orders against a book of resting bids and asks, watch the rows your order eats highlight in real time, and see the resulting slippage, spread and price impact. Start the market to bring in robot traders and market makers who refill the book after a big trade, tune liquidity from a desert-thin market to a deep ocean, and work through twelve scenarios — from a tiny order in a deep pool to a whale dump, a flash crash and a marketable limit order — that isolate exactly what spread, slippage, liquidity and price impact mean.
Play with it →